


On January 7, 2026, the USDA released its long-awaited dietary guidelines. These guidelines come out every five years, and RFK Jr. had promised a new approach this time, and the press release rhetoric suggested this was a huge change. In practice, however, the new guidelines look very much like the old.
There are some differences; the new guidelines are much shorter (which, I would argue, is good), and they increase the recommended amounts of protein. They put more of an emphasis on animal sources of protein than plant sources, relative to the past. But for the most part, the focus on whole foods, fruits, and vegetables, and less saturated fat and sugar is retained from the prior guidelines.
I wrote (mostly positively) about these new guidelines when they first came out. But there is a core problem: virtually no one eats as these guidelines suggest — either the old or the new. Here, I want to make that clear with data. I’ve pulled together our best source of data on the diets of Americans, and I’m going to show you what they look like relative to some of the guidelines.
And, at the end, some thoughts on what it would take to really close this gap, and why turning the pyramid upside down is not, actually, sufficient.
How do we know about people’s diets?
It’s very difficult to measure exactly what people eat. If you ask people to record as they eat, it typically affects how much they eat. If you want to know exactly what people consume, you essentially need to have them living in a lab, and that’s not really reflective of reality.
In practice, the best data we have on the standard diet of Americans comes from a CDC-run survey called the National Health and Nutrition Examination Survey (NHANES). The NHANES survey began in the 1960s and, after a few different iterations, has run in more or less its current form since 1999. It includes roughly 5,000 individuals each year, and it’s run continuously with data released every two years. The data is designed to be nationally representative, with a complex weighted recruiting strategy.
The NHANES collects a lot of data. People are surveyed about their household demographics and structure, and mobile clinics collect weight and other physical measurements. They also have a two-day dietary recall in which individuals are asked to list everything they ate in the two recent days. These data are then matched to calories and to macro and micronutrients.
These data are the best we have, but we know they miss some of what people eat; the average calorie intake for adults in the survey is around 1,900, which is much less than people must be eating to maintain their weight. So this survey probably captures less than the total amount of food.
For this analysis, I’ll use the most recent NHANES survey, with data collection between 2021 and 2023.
What are people actually eating?
The new dietary guidelines start with a plea for people to have more “real food.” This is not well defined. Older guidelines talked more about “whole foods,” and both emphasize avoiding highly processed foods. Part of the issue with being specific here is that it’s been challenging to define ultraprocessed foods in a way that really links to health. As I’ve written before, it is not really the processing that is a problem, but the fact that these foods encourage excess calorie consumption.
This all makes it difficult to quantify the extent to which people are eating “real food.” However, I think we can get a sense of this by looking at what foods make up the bulk of the diet. In the table below, I show the top food and drink (excluding water) for both adults and children, by either calorie share or share in terms of grams of food (it is useful to separate these since foods like vegetables weigh more but do not have a lot of calories).
The overall takeaway here is that people are eating a lot of processed food and a lot of sugar. Pizza (mostly frozen) is at the top of the calorie list for both adults and children. Soft drinks top the weight list; what this means is that, in terms of grams of food and drink consumed, the largest single item by weight for kids is soft drinks.
Also notable on this list is the absence of fruits and vegetables (other than apples; by weight, apples rank highly for kids). But by calories, it is a lot of high sugar, largely highly processed foods.
New guidelines emphasize more protein and vegetables
Two clear “to-dos” in the dietary guidelines: an increased emphasis on protein, and a continued push for people to eat more vegetables. What do actual diets look like?
Protein
The older dietary guidelines recommended 0.8 grams of protein per kilogram of body weight; the new ones say 1.2 to 1.6 grams per kilogram.
Most people are not very far off from this goal. In the NHANES data, the average adult reports about 0.95 grams of protein per kilogram of body weight, and the average child reports 1.9. This is more than the old guidelines recommended, and in the case of children, also higher than the new ones. And even for adults, given the likely underreporting of food consumption here, it seems likely most people are actually hitting at least the lower end of the new recommended range.
Given the level of activity that most Americans engage in, they may not actually need this much protein. In the end, the data suggests that most people may be just fine on this part of the guidelines.
Fruits and vegetables
The dietary guidelines recommend five servings of fruits or vegetables per day. This is somewhat difficult to measure directly in the NHANES data. But one thing we can look at is, very simply, do people report any significant vegetable consumption? To do this, I coded up all the fruit and vegetable categories — everything from whole fruits and vegetables to “vegetables on a sandwich.” I excluded juice and ketchup. But this analysis should provide a measure of whether people are consuming any meaningful amount of whole vegetables.
The graph below shows the share of adults and children who report no vegetable or fruit consumption in the two-day recall, broken down by household income level.
Averaging over everyone, almost 8% of adults and over 11% of children report no vegetables or fruits in the dietary recall. This varies a lot by income. In the highest income group (people with an income level at least four times as high as the federal poverty line), less than 5% of kids and adults have no vegetables. For the poorest group (those with income less than the federal poverty line), it’s almost 15% of adults and over 17% of children.
What about saturated fat and sugar?
The clearest nutrient “dont’s” in the guidelines — both new and old — are around saturated fat and sugar. The dietary advice suggests getting no more than 10% of calories from saturated fat, and no more than 10 grams of added sugar in each meal. This latter piece of advice is a bit hard to map directly to diets, since it is difficult in the data to separate added sugar from non-added. (For example, apples have sugar, but not added sugar). We can look at overall sugar and make some inferences from what people are eating.
Saturated fat
The average adult in the NHANES reports 12% of their calories from saturated fat. This is higher than the dietary guidelines, but it is not actually that much higher. I see this alignment as similar to protein; we’re not quite there, but it’s not that far off. People have noted that in the new guidelines, there is a push towards whole milk and animal protein, which could increase saturated fat consumption. On the other hand, if that came with a reduction in highly processed foods, that would offset. But overall, at the moment, diets are not that far off from the recommendations for saturated fat.
Sugar
The sugar situation is different. The average adult in these data consumes 95 grams of sugar per day; the average child consumes 97. This combines both natural and added sugars, but looking at the food sources, it is clear that many of these sugars are added.
One way to see this: I defined foods as “high sugar” if more than 20% of the weight is in sugar. This means that a food like an apple is not high sugar (even a very sweet apple is about 13 grams of fructose per 100 grams), but a food like Honey Smacks cereal definitely is (50 grams of sugar per 100 grams of weight). The graph below shows the share of calories, for adults and children, which come from high-sugar foods. As with vegetables, I have broken this down by income level.
There are two notable facts here. First, a lot of calories come from high-sugar foods. On average, 14% of total calories consumed in a day among adults are for foods in this category, over 15% for children. I will note: this excludes soda and most other soft drinks, which have a lot of sugar but aren’t high sugar by this definition.
Second, unlike in the case of vegetables, this doesn’t move with income very much. If anything, people with higher incomes are consuming more high-sugar foods than people with lower incomes. This aligns with the data on total sugar consumption across groups.
What policy changes can help?
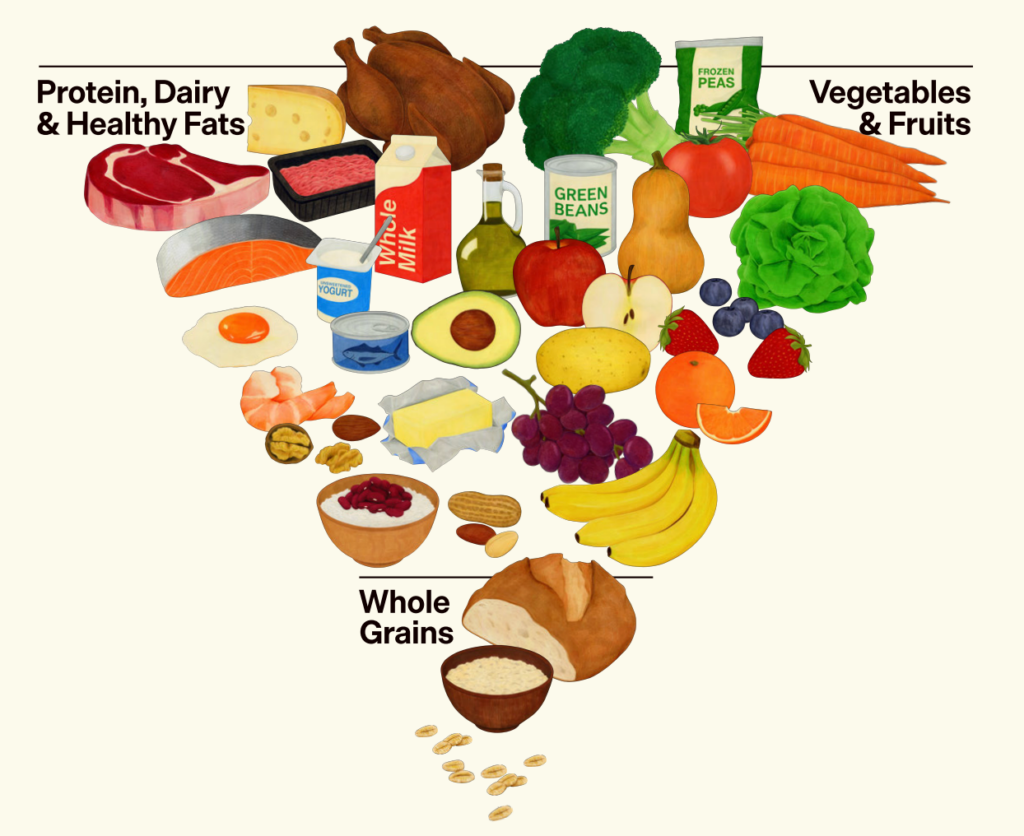
The typical American diet is quite different from either the new or old dietary guidelines. Notably, there is more of a difference between how people actually eat and these guidelines than there is between the guidelines themselves. In at least some of the discussions, online commenters want to fight about the size of the steak at the top of the pyramid. I agree, this steak is out of scale (so are the carrots and blueberries). But if we drew out the average diet people are consuming, the top of the pyramid is a frozen pizza, a box of Cinnamon Toast Crunch, and soda. It’s not even close.
So, what would it take to change diets on a real scale?
Clearly, telling people how to eat better is not enough. We have been doing that for decades, and if anything, diets have probably gotten worse. The problem is that changing diet is hard for many reasons, and until policy helps on those dimensions, we’re a little stuck. Here are three quick thoughts on how we could help.
Increase resources and access
If you look at the data on vegetables, it’s very clear that income plays a role. This is true for many reasons, but one of them is resources and access. Vegetables are expensive, and often poorly stocked in stores in many areas (some areas may not have grocery stores at all), and they often require work to cook. Policy could do more to make produce available and appealing, including doing more on this dimension in school lunches. Just telling people to eat produce without giving them the resources to do so is going nowhere.
Regulate sugar in food
I recognize this as a somewhat politically fraught talking point, but there is too much sugar in too many foods. Even if you are attempting to avoid sugar, it’s literally everywhere — in bread, yogurt, beef jerky (seriously). Especially for parents, we’ve made it extremely difficult to limit sugar. If the dietary guidelines are going to say (as they do) that kids under 10 should never have added sugar, they should at least help us out a bit by not putting sugar in whole wheat bread.
Increase access to GLP-1s
Again, an argument not without controversy, but the data on dieting make clear that weight loss from dietary changes alone is extremely difficult for most people. Increased access to GLP-1s will make this a more feasible option for many individuals, and with these drugs, there is an opportunity to not only reduce calories but also change the structure of diets. Sustained moves towards these dietary guidelines should be part of the counseling that comes with these GLP-1 prescriptions.
The bottom line
- While most Americans already meet protein targets, a large share, especially lower-income families, report eating no fruits or vegetables at all.
- Americans are only slightly over the guidelines for saturated fat, but sugar intake is high across all income levels, especially for children.
- Telling people what to eat is not enough. Decades of government dietary advice hasn’t meaningfully changed how Americans eat. Real progress will require policy changes, and thus far, that hasn’t happened in a substantial enough way.


Log in
Recent NHANEs surveys have suggested that one third of Americans older than 50 years of age and somewhat more than half of women older than 70 years of age consume less than 0.8 grams of protein per kg body weight. If true, it is plausible that protein deficiency may contribute significantly to age-related muscle loss and increase the risk for falls.
Does the NHANES survey factor in seasonality at all? We try to eat locally and in season, and belong to a CSA. Our diet during the warmer months is vastly different from the colder months. If I was asked to recall what I ate in 2 recent days right now, versus in July, it would be night and day.
Seems odd to have a section about more resources for eating healthily, while studiously failing to mention that this administration is actively cutting said resources like SNAP…surely pointing out such facts shouldn’t require that much bravery?
Increase GLP-1 Access?? Very controversial, indeed! Promoting taking drugs to solve the issue of a health crisis, I do not think is the right path especially since this article is for the general audience that might not be obese or have type 2 diabetes. Also, shouldn’t it warn about potential gastrointestinal symptoms for taking these drugs? Inflammation of pancreas, bowel obstruction, the fact that it causes slow digestion, which is not normal btw? Just because GLP-1 is becoming a trend or popular doesn’t make this drug the answer for the American population.