Emily Oster

9 min Read Emily Oster

Emily Oster

Competing With Your Younger Self

What running times can tell us about slowing down

Emily Oster

9 min Read

My family have always been runners.

My favorite picture of one of my younger brothers is when he’s perhaps 5 or 6, crossing the finish line of a race, stopping his watch. It’s not just that he was running races at this age, it’s that he was concerned about his time. This kind of slightly extreme attitude toward recreational running has had a hold over me, that brother, and my dad more or less since I can remember (my mom and the other brother were largely spared).

When I was a kid, I vividly remember Dad’s quest for the sub-3-hour marathon. He finally got it in the 1987 Philadelphia Marathon (2:58:45). It was the era before cellphones, so we didn’t find out until he got home, and I recall standing on the porch and just how happy he was.

We are all familiar with that chasing of the PR [personal record], of trying to hit some elusive round time goal. It’s easy to see the accomplishment there. But there is also the unfortunate reality that, as we age, it gets less realistic. At 42, I ran some PRs last year, but only because I moved to distances I hadn’t done before (the “auto-PR”). My dad is 80 now. He still runs most days, and is always trying to get faster, but the 3-hour marathon isn’t in reach.

What do we chase when we can’t chase the PR? One option is chasing other people — we can try to hit age-group wins and age-group times. But most of us aren’t winning age groups. And for many of us, the competition with ourselves has long been our main driving force. The question is: How can I compete with my younger self? How do I know if I’m outpacing her?

My dad, Ray Fair, asked the same question in the late 1980s, as he neared 50. In addition to sharing a love for running, he and I also share a love for data and a passionate belief that it can inform our lives in ways that other people might not expect. I’m an economist, and I have made a career of translating data into actionable insights for parents. My dad is also an economist, and while his focus is on more traditional economic topics (namely, the macroeconomy — he’s an economics professor at Yale), he could not avoid the temptation to use data to figure out where he stood relative to his past self.

In 1994, Dad published a paper in a reputable economics journal with the title “How Fast Do Old Men Slow Down?” The basic idea in the research is to ask, effectively, what the impacts of aging are at the upper limits of performance. A secondary use of this data is to translate it to our own running.

What the paper actually does is look at world records, by age, in various running events and fit-curves to them. To make this more concrete, I’ve pulled out the current single-year age records for men and women in the marathon in the graph below.

A chart from Emily Oster shows marathon record running times by age, with a sharp increase after age 70.

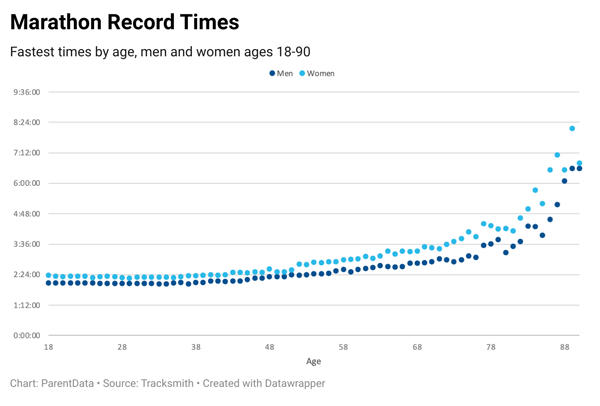
The graph suggests a particular shape to our age-based decline. First, performance is pretty flat up to age 40. There is then a pretty steady linear slowdown up until sometime in your 70s. After that, the decline begins to accelerate.

The analysis in the paper uses data like this to estimate (1) how slow the decline is in that first phase, after 40, (2) at what age the decline starts to accelerate, and (3) how fast it declines after that. From these numbers, it’s possible to calculate your own expected decline.

What the paper actually calculates is an expected percentage decline by age. What Dad ends up concluding is that your performance will decline by about 1% per year until age 77, and then much faster after that. This is an average that is pretty consistent across race distances. (Noting: For data limitation reasons, all the analysis is done on men. However, the graph above suggests that women look pretty similar.)

The result of all this is an expected percentage decline by year. We can then apply this to our own racing. If the world records represent the absolute minimum time by age, then the evolution across the records reflects the most optimistic view of how we can sustain our times. By applying this to ourselves, we can ask how much (or not!) we fall off this trend.

To give a more concrete example: Last year, I ran a half-marathon in 1:34:52. I was 42. This year, I’m 43. Based on last year’s time, I should be able to run 1:35:47 this year — that’s a bit of a slowdown. Anything faster than that, even if slower than 1:34:52, would be an “age-graded PR.”

In the space of a year or two, especially before that pivot around 77, this doesn’t make a huge difference. But the years do add up to mattering. Dad has all of his marathon times up on his website (of course), and he noted for me that his best corrected age time is at age 53, when he ran a 3:10 marathon. Based on age grading, his sub-3-hour performance was only his third-best effort.

Age-grading yourself in this way can make you feel better about your current performances. It also has the side effect of making you feel worse about your earlier ones. For example: Let’s say I am able to accomplish my goal of running 1:32:00 in my next half-marathon, at age 43. On one hand, I’ll feel great. On the other hand, this tells me that I could have run as fast as 1:31:06 last year, at 42. Not as great.

[Author’s note: After this piece was written, I did run a PR in the half, 1:30:52. What this tells me, heartbreakingly, is I could have run 1:29:57 at age 42. I missed my chance to go sub-1:30!]

The most complicated part of this analysis comes when we start to look at much older groups.

First problem: there just are not a lot of very, very old people running marathons. This is a problem for fitting the data. We can, perhaps, be reasonably confident about the decline between ages 40 and 50, when many people run competitively. But there are fewer people in their 80s running marathons at all, let alone for time. This is especially true for women — as Dad says in his paper, “More time is needed to build up a sample of old women running road races.”

The oldest age records also pose another conundrum. There are some extremely impressive times. Most notably, Ed Whitlock of Canada holds the records at ages 68, 69, 73, 74, 75, 76, 80, 81, 82, and 85. At 73, he ran 2:54:48. Using age grading, this would suggest Ed could have run a 2:05 marathon when he was 40. This would put him in the records in that age range too, but he is not anywhere to be seen. In fact, his fastest marathon ever was 2:31, at age 48. A very respectable time, but not close to a record.

What happened? Ed ran as a teenager but then he stopped, and he took it up again in his 40s. This leads to an interesting question: If he had been running all those years in between, would he have had the stamina (or the knees) to run under 4 hours at age 85? I’m not sure.

The advantage of the “world record” approach to the data is that we are really seeing the limits at each age. But the disadvantage is that we are not seeing the path of a single person, and it seems very plausible that the individuals who are performing well when they are old are different from those who perform well when they are younger. Not always true — [Olympian] Joan Benoit Samuelson is in there with the record for 53-year-olds — but often.

My dad said this slightly differently when we talked about it. This approach, he points out, assumes that, while people vary in their pace and capacity, their potential decline is similar to some biological minimum defined by elite runners. In his view, this is perhaps not unreasonable for younger people, but as we age, there is just more variation and a lot less data. That leaves open space for one unusual person to really drive the results. Ed Whitlock may be a good metric of our maximum biological capacity, but he also may not reflect a reasonable path. This is underscored, I think, by the fact that the records at older ages are very concentrated in a few individuals.

A final interesting question: These data are based on the past. In an era of super-shoes, of better understanding of the value of cross-training, of better fueling options — could we age more slowly in our running? In 50 years, when we do these same estimations, would we find that the decline starts later, or goes less quickly? Impossible to say; perhaps we will have to wait until [world-record holder Eliud] Kipchoge is 75 to find out if he can beat his predicted age-adjusted marathon time (2:50).

What about my 80-year-old dad? The race he has most consistently run is the Labor Day 20K in New Haven. It’s been going for 45 years; he missed only two instances. He’s got his list of times, along with four friends who have also completed the race nearly every year. As he says:

Even though my best time ever was 1:18:40, at age 43, my best age-corrected time according to the age factors used on this site was 1:20:30 at age 48. The predicted minimum times [in his list] use the 1:20:30 performance at age 48 as the base. As you can see, my races since age 62 have been way off the regression line. The fault, I fear, is not in the line but in myself. The results for four other people reported on this site suggest that the line is fine.

This is spoken like a true lover of evidence. He’s willing to defend the data, even if it throws his running under the bus.


As many of you know, I like to run. And my go-to running clothes, which you will see if you watch my sweaty morning Instagram stories, are from Tracksmith. A few months ago, Tracksmith asked if I’d write something about running and data for Meter Magazine. I wrote about my dad, about research, and about using data to compete with your past self. Tracksmith generously agreed to let me reprint the piece here!

0 Comments
Inline Feedbacks
View all comments
Fitness bands and rollers for stretching on a pink background.

Feb 24 2023

2 min read

What Are the Best Pre- and Post-Running Stretches?

Ask ParentData

Emily Oster
Close up of a person jogging at sunrise.

Aug 30 2023

4 min read

Do I Have to Stop Running Before an Egg Retrieval?

My wife and I have gone through six rounds of intrauterine insemination each (all unsuccessful), so we are going to Read more

Emily Oster
A group of babies listening to ParentData on headphones

May 24 2023

38 min read

All Your Questions About Running

Welcome to ParentData. If you read my newsletter or follow me on Instagram, you know that running is a big Read more

Emily Oster
An illustration of a head, with the top opening up to reveal a rainbow of colors against a blue background.

Oct 10 2023

10 min read

I Hit My Head and Learned Three Lessons

At the end of September, I went to a conference in Denver. The first morning, I went for a run Read more

Emily Oster

Instagram

left right
I hear from many of you that the information on ParentData makes you feel seen. Wherever you are on your journey, it’s always helpful to know you’re not alone. 

Drop an emoji in the comments that best describes your pregnancy or parenting searches lately… 💤🚽🍻🎒💩

I hear from many of you that the information on ParentData makes you feel seen. Wherever you are on your journey, it’s always helpful to know you’re not alone.

Drop an emoji in the comments that best describes your pregnancy or parenting searches lately… 💤🚽🍻🎒💩
...

Milestones. We celebrate them in pregnancy, in parenting, and they’re a fun thing to celebrate at work too. Just a couple years ago I couldn’t have foreseen what this community would grow into. Today, there are over 400,000 of you here—asking questions, making others feel seen wherever they may be in their journey, and sharing information that supports data > panic. 

It has been a busy summer for the team at ParentData. I’d love to take a moment here to celebrate the 400k milestone. As I’ve said before, it’s more important than ever to put good data in the hands of parents. 

Share this post with a friend who could use a little more data, and a little less parenting overwhelm. 

📷 Me and my oldest, collaborating on “Expecting Better”

Milestones. We celebrate them in pregnancy, in parenting, and they’re a fun thing to celebrate at work too. Just a couple years ago I couldn’t have foreseen what this community would grow into. Today, there are over 400,000 of you here—asking questions, making others feel seen wherever they may be in their journey, and sharing information that supports data > panic.

It has been a busy summer for the team at ParentData. I’d love to take a moment here to celebrate the 400k milestone. As I’ve said before, it’s more important than ever to put good data in the hands of parents.

Share this post with a friend who could use a little more data, and a little less parenting overwhelm.

📷 Me and my oldest, collaborating on “Expecting Better”
...

I spend a lot of time talking people down after they read the latest panic headline. In most cases, these articles create an unnecessary amount of stress around pregnancy and parenting. This is my pro tip for understanding whether the risk presented is something you should really be worrying about.

Comment “link” for an article with other tools to help you navigate risk and uncertainty.

#emilyoster #parentdata #riskmanagement #parentstruggles #parentingstruggles
...

Here’s why I think you don’t have to throw away your baby bottles.

Here’s why I think you don’t have to throw away your baby bottles. ...

Drop your toddlers favorite thing right now in the comments—then grab some popcorn.

Original thread source: Reddit @croc_docs

Drop your toddlers favorite thing right now in the comments—then grab some popcorn.

Original thread source: Reddit @croc_docs
...

Just keep wiping.

Just keep wiping. ...

Dr. Gillian Goddard sums up what she learned from the Hot Flash  S e x  Survey! Here are some key data takeaways:

🌶️ Among respondents, the most common s e x u a l frequency was 1 to 2 times per month, followed closely by 1 to 2 times per week
🌶️ 37% have found their sweet spot and are happy with the frequency of s e x they are having
🌶️ About 64% of respondents were very or somewhat satisfied with the quality of the s e x they are having

Do any of these findings surprise you? Let us know in the comments!

#hotflash #intimacy #midlifepleasure #parentdata #relationships

Dr. Gillian Goddard sums up what she learned from the Hot Flash S e x Survey! Here are some key data takeaways:

🌶️ Among respondents, the most common s e x u a l frequency was 1 to 2 times per month, followed closely by 1 to 2 times per week
🌶️ 37% have found their sweet spot and are happy with the frequency of s e x they are having
🌶️ About 64% of respondents were very or somewhat satisfied with the quality of the s e x they are having

Do any of these findings surprise you? Let us know in the comments!

#hotflash #intimacy #midlifepleasure #parentdata #relationships
...

Should your kid be in a car seat on the plane? The AAP recommends that you put kids under 40 pounds into a car seat on airplanes. However, airlines don’t require car seats.

Here’s what we know from a data standpoint:
✈️ The risk of injury to a child on a plane without a carseat is very small (about 1 in 250,000)
✈️ A JAMA Pediatrics paper estimates about 0.4 child air crash deaths per year might be prevented in the U.S. with car seats 
✈️ Cars are far more dangerous than airplanes! The same JAMA paper suggests that if 5% to 10% of families switched to driving, then we would expect more total deaths as a result of this policy. 

If you want to buy a seat for your lap infant, or bring a car seat for an older child, by all means do so! But the additional protection based on the numbers is extremely small.

#parentdata #emilyoster #flyingwithkids #flyingwithbaby #carseats #carseatsafety

Should your kid be in a car seat on the plane? The AAP recommends that you put kids under 40 pounds into a car seat on airplanes. However, airlines don’t require car seats.

Here’s what we know from a data standpoint:
✈️ The risk of injury to a child on a plane without a carseat is very small (about 1 in 250,000)
✈️ A JAMA Pediatrics paper estimates about 0.4 child air crash deaths per year might be prevented in the U.S. with car seats
✈️ Cars are far more dangerous than airplanes! The same JAMA paper suggests that if 5% to 10% of families switched to driving, then we would expect more total deaths as a result of this policy.

If you want to buy a seat for your lap infant, or bring a car seat for an older child, by all means do so! But the additional protection based on the numbers is extremely small.

#parentdata #emilyoster #flyingwithkids #flyingwithbaby #carseats #carseatsafety
...

SLEEP DATA 💤 PART 2: Let’s talk about naps. Comment “Link” for an article on what we learned about daytime sleep!

The first three months of life are a chaotic combination of irregular napping, many naps, and a few brave or lucky souls who appear to have already arrived at a two-to-three nap schedule. Over the next few months, the naps consolidate to three and then to two. By the 10-to-12-month period, a very large share of kids are napping a consistent two naps per day. Over the period between 12 and 18 months, this shifts toward one nap. And then sometime in the range of 3 to 5 years, naps are dropped. What I think is perhaps most useful about this graph is it gives a lot of color to the average napping ages that we often hear. 

Note: Survey data came from the ParentData audience and users of the Nanit sleep monitor system. Both audiences skew higher-education and higher-income than the average, and mostly have younger children. The final sample is 14,919 children. For more insights on our respondents, read the full article.

SLEEP DATA 💤 PART 2: Let’s talk about naps. Comment “Link” for an article on what we learned about daytime sleep!

The first three months of life are a chaotic combination of irregular napping, many naps, and a few brave or lucky souls who appear to have already arrived at a two-to-three nap schedule. Over the next few months, the naps consolidate to three and then to two. By the 10-to-12-month period, a very large share of kids are napping a consistent two naps per day. Over the period between 12 and 18 months, this shifts toward one nap. And then sometime in the range of 3 to 5 years, naps are dropped. What I think is perhaps most useful about this graph is it gives a lot of color to the average napping ages that we often hear.

Note: Survey data came from the ParentData audience and users of the Nanit sleep monitor system. Both audiences skew higher-education and higher-income than the average, and mostly have younger children. The final sample is 14,919 children. For more insights on our respondents, read the full article.
...

Happy Father’s Day to the Fathers and Father figures in our ParentData community! 

Tag a Dad who this holiday may be tricky for. We’re sending you love. 💛

Happy Father’s Day to the Fathers and Father figures in our ParentData community!

Tag a Dad who this holiday may be tricky for. We’re sending you love. 💛
...

“Whilst googling things like ‘new dad sad’ and ‘why am I crying new dad,’ I came across an article written by a doctor who had trouble connecting with his second child. I read the symptoms and felt an odd sense of relief.” Today we’re bringing back an essay by Kevin Maguire of @newfatherhood about his experience with paternal postpartum depression. We need to demystify these issues in order to change things for the better. Comment “Link” for a DM to read his full essay.

#parentdata #postpartum #postpartumdepression #paternalmentalhealth #newparents #emilyoster
...

What does the data say about children who look more like one parent? Do they also inherit more character traits and mannerisms from that parent? Let’s talk about it 🔎

#emilyoster #parentdata #parentingcommunity #lookslikedaddy #lookslikemommy

What does the data say about children who look more like one parent? Do they also inherit more character traits and mannerisms from that parent? Let’s talk about it 🔎

#emilyoster #parentdata #parentingcommunity #lookslikedaddy #lookslikemommy
...

SLEEP DATA 💤 We asked you all about your kids’ sleep—and got nearly 15,000 survey responses to better understand kids’ sleep patterns. Comment “Link” for an article that breaks down our findings!

This graph shows sleeping location by age. You’ll notice that for the first three months, most kids are in their own sleeping location in a parent’s room. Then, over the first year, this switches toward their own room. As kids age, sharing a room with a sibling becomes more common. 

Head to the newsletter for more and stay tuned for part two next week on naps! 🌙

#parentdata #emilyoster #childsleep #babysleep #parentingcommunity

SLEEP DATA 💤 We asked you all about your kids’ sleep—and got nearly 15,000 survey responses to better understand kids’ sleep patterns. Comment “Link” for an article that breaks down our findings!

This graph shows sleeping location by age. You’ll notice that for the first three months, most kids are in their own sleeping location in a parent’s room. Then, over the first year, this switches toward their own room. As kids age, sharing a room with a sibling becomes more common.

Head to the newsletter for more and stay tuned for part two next week on naps! 🌙

#parentdata #emilyoster #childsleep #babysleep #parentingcommunity
...

Weekends are good for extra cups of ☕️ and listening to podcasts. I asked our team how they pod—most people said on walks or during chores. What about you?

Comment “Link” to subscribe to ParentData with Emily Oster, joined by some excellent guests.

#parentdata #parentdatapodcast #parentingpodcast #parentingtips #emilyoster
...