


I love coffee. Before my first pregnancy, I was easily at three to four cups a day — one with breakfast, one for a mid-morning break, maybe one in the early afternoon. So when I found out I was pregnant, the coffee question was not abstract. It was urgent. I had a caffeine withdrawal headache coming on, I was about to sit through a day of conference talks, and I needed to know: could I have a cup or not?
The official guidance I found was all over the place. My OB said under 200 milligrams (mg) a day (roughly two 8-ounce cups) was fine. A friend’s OB said 300. The Mayo Clinic Guide to a Healthy Pregnancy ruled out caffeine entirely. What to Expect went with the 200-mg rule but suggested checking with your own OB because their recommendation might differ. The American College of Obstetricians and Gynecologists (ACOG) landed at 200 mg. None of these sources could have been looking at the same data, or at least they were not interpreting it the same way.
So I did what I always do: I went to the studies.
The main concern: miscarriage
The reason caffeine gets flagged during pregnancy is a potential link with miscarriage, particularly in the first trimester. Caffeine does cross the placenta, and it’s not entirely clear how the fetus processes it. Researchers have also speculated that caffeine can limit blood flow to the placenta and inhibit fetal development.
What has been shown in a well-controlled way is that very high doses of caffeine do cause miscarriage in mice and rats. But these doses are much, much higher than what people consume.
To understand the impact of normal amounts of coffee in people, it’s more helpful to look at studies of people. When I got into the actual research, in addition to the typical issues of correlation vs. causation, I found something important: the studies on caffeine and miscarriage have a serious, pervasive problem — and that problem is nausea.
Nausea in early pregnancy is, counterintuitively, a good sign. Women who experience morning sickness are less likely to miscarry; it’s a sign of a healthy pregnancy (although it is also important to note that the majority of women without nausea do not miscarry).
The problem is that nausea also makes coffee undrinkable. During my first trimester, my usual morning routine (coffee before breakfast, on an empty stomach) became genuinely revolting. Talking with other pregnant women, this is completely typical. But this means that women who drink a lot of coffee are probably those who are not experiencing nausea. This may make it appear that caffeine and miscarriage are linked, when they are really not. There is a third factor related to the health of the pregnancy that influences both.
Researchers know this is a problem and try to adjust for it. But nausea isn’t a yes-or-no thing. Some women feel slightly off. Others are vomiting multiple times a day for months. A single adjustment question can’t capture that spectrum. As one review article concluded, it is basically impossible to fully separate caffeine and nausea — and it’s possible, even likely, that much of the apparent caffeine-miscarriage link is actually this confounder at work.
Two other pieces of evidence reinforced my skepticism about the caffeine story. Tea and soda also contain caffeine, but they’re much easier on a nauseous stomach — and they’re much less consistently linked with miscarriage. If caffeine were the real driver, you’d expect similar associations across sources. And one study found that decaffeinated coffee was as strongly linked to miscarriage as regular coffee. Decaf has the same nausea problem. It has no caffeine. That is very hard to explain if caffeine is what’s causing harm.
What about moderate coffee drinking?
When I looked at the studies that try hardest to deal with these issues, the picture for moderate consumption was reassuring.
A 2010 study from Maryland followed women from the time they were trying to conceive, using daily diet diaries — so researchers didn’t have to rely on memory, and even early miscarriages were captured. It found no relationship between caffeine and miscarriage. The sample was small (only 66 pregnant women), so it’s suggestive rather than definitive.
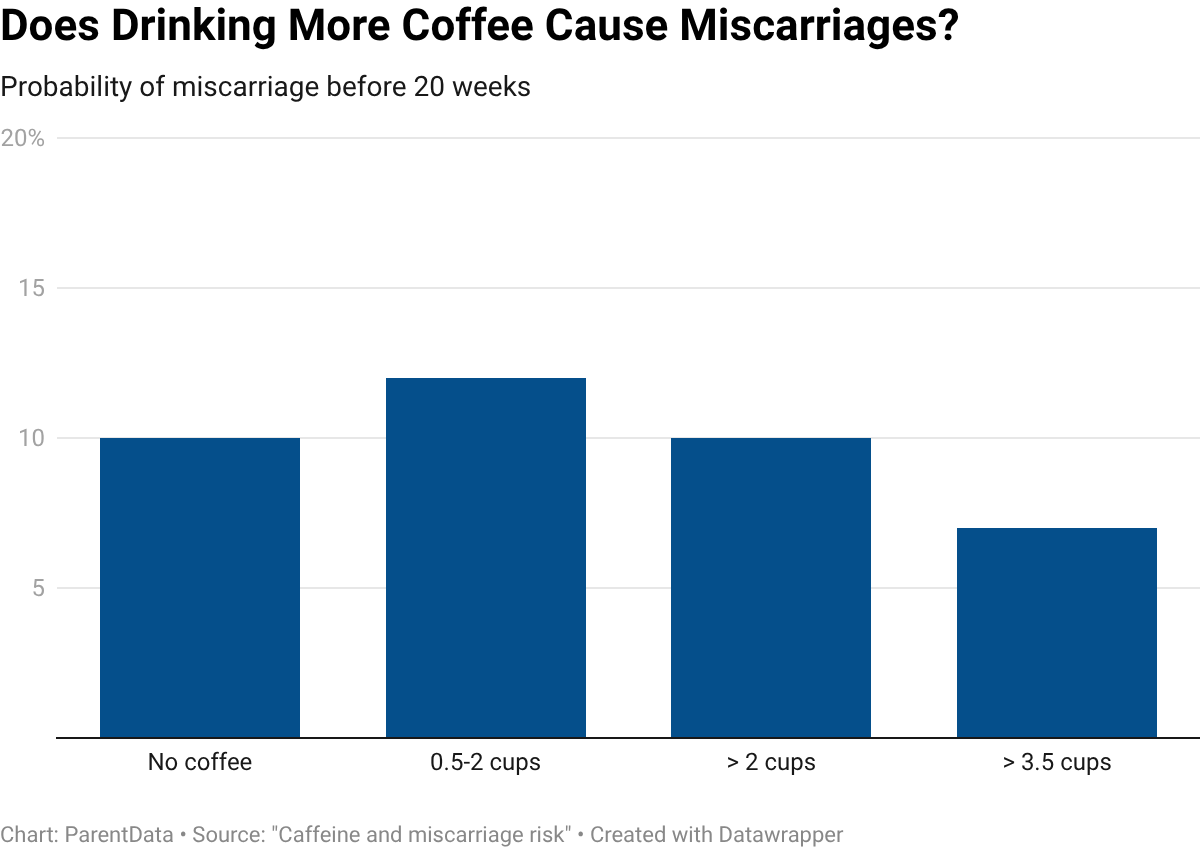
But a much larger study published in Epidemiology in 2008, covering about 2,400 women, found essentially the same thing: no statistically significant difference in miscarriage rates between women who drank no coffee and those who drank up to about two cups a day. Women drinking even more had, if anything, slightly lower miscarriage rates — also not statistically significant, but certainly not what you’d expect if caffeine were the culprit. A Danish study of nearly 100,000 women reached similar conclusions for consumption up to three cups a day.
There is one California study from around the same time that did find higher miscarriage rates among women drinking more than 200 mg a day. For some women, and for ACOG, this study may be enough to conclude that pregnant women should stick to less than 200 mg a day. For me, however, there were enough aspects of the study that gave me pause and suggested that perhaps this is just the nausea story all over again.
The researchers tried to adjust for nausea using a yes/no question — but as I noted, that adjustment doesn’t go nearly far enough. The study also found no effect of coffee among women who had reduced their intake, regardless of what level they landed at. That’s a strange result if caffeine itself is the problem, and it’s exactly what you’d expect if what really mattered was whether someone felt sick enough to cut back.
I ultimately concluded that the weight of the evidence didn’t support limiting my consumption very much. I decided the three to four cups a day I was having was fine. It’s possible you will read this evidence and decide that you would like to stay under two cups. There’s no reason to have less than that if you feel up to it.
What about more than four cups a day?
The evidence gets genuinely murkier at higher intake levels.
The first thing to note is that studies of women at this higher level of consumption are, if anything, even more subject to the concerns about nausea. If you are feeling at all nauseous, at any time of the day, you are probably not having eight cups of coffee. Perhaps for this reason — or, perhaps, because too much coffee really is a problem — studies are more consistent at showing a link between very high caffeine intake and miscarriage.
A Danish study of nearly 100,000 women found higher rates of late miscarriage (after 16 weeks) among women drinking eight or more cups a day — about 1.9% in the high-caffeine group versus 1.2% in the low-caffeine group. (Miscarriage in this period is not very common, so the overall numbers in the study are small.) A Swedish study in the New England Journal of Medicine found that women drinking more than five cups a day were about twice as likely to lose their pregnancy in the first trimester compared to those having one cup or less.
The Swedish study has an additional wrinkle: women who miscarried were asked about their coffee intake after their loss. Many miscarriages are “missed” — meaning the fetus dies a week or two before symptoms appear. Nausea often subsides when this happens. So in the days before a woman knew she had lost the pregnancy, she may have been feeling better and drinking more coffee. That would make the coffee look causal, when the sequence was actually reversed.
In my view, a reasonable person could see the case for reducing caffeine intake, and a similarly reasonable person could conclude that the results are probably all driven by differences in nausea and therefore continue on as before.
What about caffeine from other sources?
Coffee gets most of the scrutiny, but caffeine shows up in a lot of places. The short answer is that the same logic applies across sources — and many of the alternatives have so little caffeine that they’re simply not a meaningful concern.
A 12-ounce can of Diet Dr. Pepper, for example, has about 41 mg of caffeine. Even having one most afternoons of the week puts you well under any reasonable limit. Coca-Cola has about 35 mg per 12 ounces; Mountain Dew runs around 50. Tea ranges from 14 to 61 mg depending on strength. Kombucha has a minimal amount of caffeine — far less than tea — and is simply not a significant concern on caffeine grounds.
For coffee specifically, brand and preparation method matter more than you might think. An 8-ounce Starbucks brewed coffee has about 165 mg. A McDonald’s brewed coffee clocks in around 100. A Starbucks latte runs about 150. If you’re paying attention to your intake, where you get your coffee matters as much as how many cups you have.
If you’ve switched to decaf out of caution — or heard that decaf isn’t safe because of methylene chloride used in some processing methods — here’s the short answer: drinking decaf does not give you the kind of exposure that creates health concerns. The studies that look at caffeine and pregnancy outcomes also examine decaf, and there’s no consistent signal of miscarriage or preterm birth risk from decaf consumption.
Decaf is fine. But if you’d rather have regular coffee, that’s fine too.
The bottom line
Here’s my read of the evidence:
Up to two cups a day: Very reassuring. Multiple large studies across different countries find no link with miscarriage. The randomized trial shows no effect on birth outcomes. If this is where you land, you can feel confident.
Two to four cups a day: The evidence is still largely supportive. The most well-designed studies don’t show harm at this level. Much of the conflicting data is likely explained by the nausea confounder. This is where I landed in my own pregnancies.
More than four cups a day: Murkier. There’s some evidence of increased miscarriage risk, though the nausea issue still applies and the causal story is hard to nail down.
The ACOG recommendation of 200 mg per day is a reasonable, cautious place to draw a line. But it’s not the only defensible position. And the data does not support the claim that any caffeine during pregnancy is dangerous.
Community Guidelines


Log in
Apparently a new study has found a tie between caffeine in pregnancy and childhood behavior problems at age 9+. Any thoughts on their findings/methods?
Reference:
Prenatal caffeine exposure: association with neurodevelopmental outcomes in 9- to 11-year-old children, Journal of Child Psychology and Psychiatry DOI: 10.1111/jcpp.13495