


Developmental milestones hold a certain combination of joy and fear for parents. On the one hand, we eagerly look forward to the first smile, the first step, the first word. On the other hand, milestones are an opportunity to fear that our children are behind and that they aren’t measuring up. When the guidelines say, “the average age for walking is 12 months,” and your 15-month-old is still crawling around, it can be a source of stress (I speak to this one from experience).
In fact, the goal of developmental milestones is to have a simple way to identify a child who may need some help via early intervention. Early intervention refers to a suite of services available to children with developmental delays or disabilities — these programs can help children catch up to their peers. Given that, identifying eligible children is a high priority.
When it comes to speech and language development, most parents want to know where their child falls. How many words should they say, and by when? And does it matter? Is talking early a marker of anything later?
What do the guidelines say?
Here are the full CDC guidelines. I’ve pulled out the language and communication milestones for each age group in the table below.
These milestones are intended to represent levels of concern, not averages. The median child says several words by one year of age, but at this age, there isn’t a flag for concern unless the child isn’t saying a caregiver word like “mama” or “dada.”
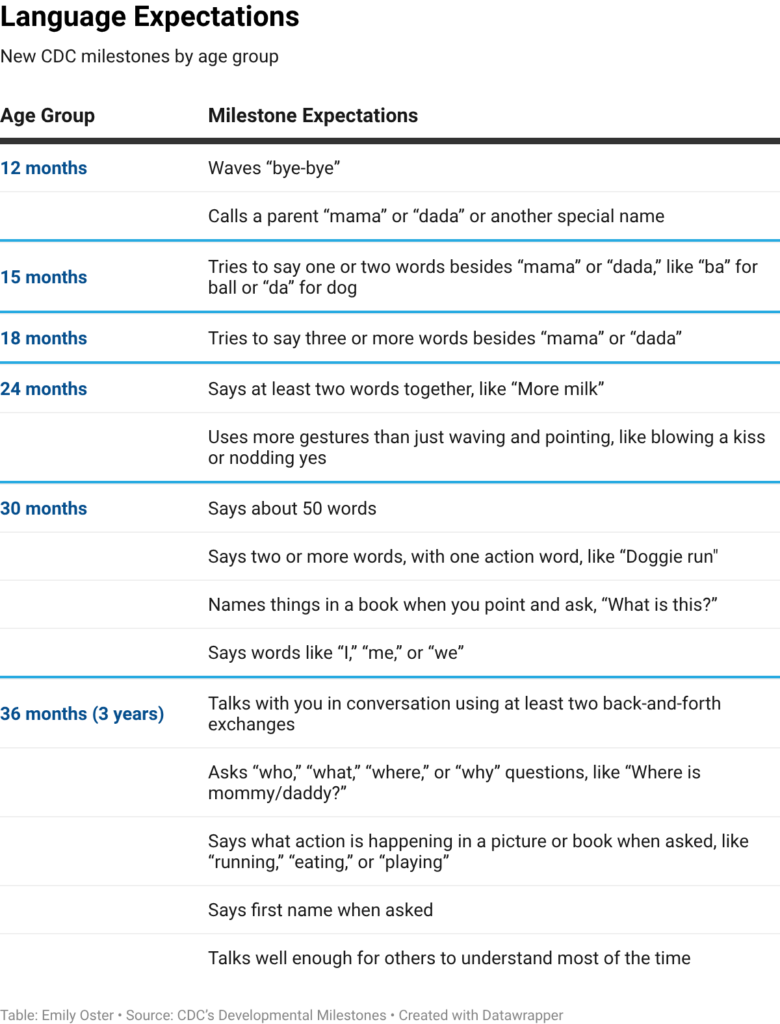
One thing that this table makes clear is the explosion in language around 18 months. In moving from 24 months to 36 months — that’s two to three years — the expectation for what most children can do moves from putting two words together to “talks well enough for others to understand, most of the time.”
How do you count words?
It’s hard to count words when you get above a small number. When your child says five or ten words, you could probably remember what they are if someone asked you. However, once your child starts using 50 or 100 words, you’re less likely to know the exact number.
For research purposes, if we want to get a sense of the full distribution of language across the population at various ages, it’s necessary to approach it more systematically.
A standardized approach is to identify a target word set — a compilation of common words — and collect data on the number of these words that children know. It’s possible to then look at the distribution across ages in how many words children know. The most popular word list is from the MacArthur-Bates Communicative Development Inventories (MB-CDIs). It has a list of simple words — blanket, kitty, uh-oh — and asks parents if their child understands the word and if they can say it.
These forms are commonly used by many researchers in child development, and there’s a project at Stanford University called Wordbank that compiles a significant body of the data on this. Their research can give us a clear picture of when language first appears and what it looks like during the toddler years.
Generally, the data points from Wordbank are not nationally representative data. There are many more parents with college or graduate degrees than you would see in the overall population, for example. However, the data in the graphs below has been reweighted to more accurately represent the overall population, so we can be a bit more confident in these averages.
When do children start to speak?
The surveys and data for younger children focus on both words and gestures (or signs).
The lines in the graph below show “quantiles” — basically, the distribution of words at each age. Take, for example, age 16 months. This data says that the average child — that’s the 50th percentile line — at 16 months has about 36 words or gestures. A child at the 10th percentile — so, near the bottom of the distribution — has only about two words or gestures. On the other end, a child at the 90th percentile has over 150 words.
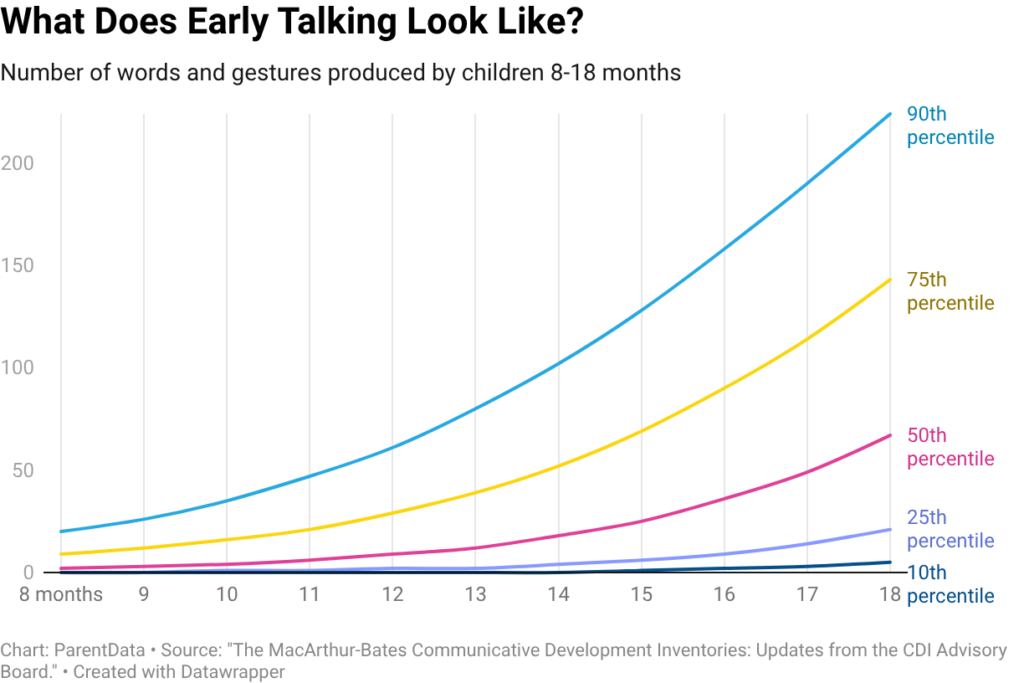
One main takeaway here is the growth of language over this period. At 8 months, most children have very little communication. By 18 months, most are talking or gesturing.
The second important takeaway is the huge variation here. On average, you’ll get the first words or gestures before a year, but if that doesn’t happen, it’s also well within the distribution.
How much do toddlers talk?
As children move into the toddler years, their language develops rapidly. Once again, looking at the quantiles here can help us see the full range of experiences for this age group.
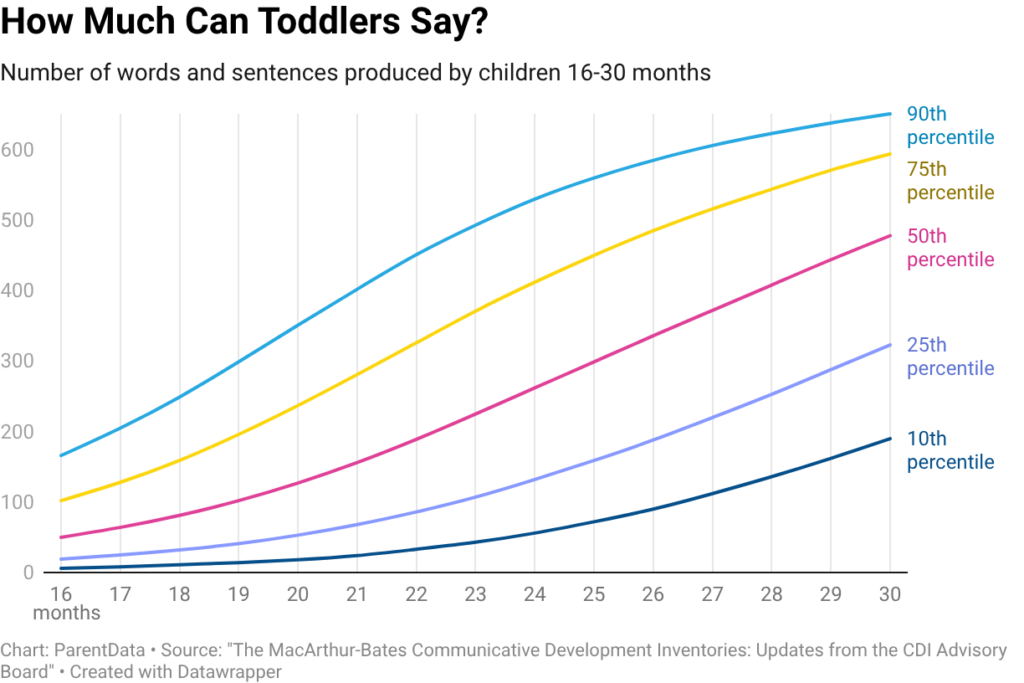
What I like about this graph is that it provides something beyond a general guideline about when to be worried and offers reassurance that it is normal for kids to differ quite a lot in their language development at younger ages.
There is, in fact, tremendous variability in how quickly kids learn to speak around the world, which can also be impacted by things like gender (boys develop more slowly than girls) and the number of languages (bilingual children are generally slower to talk, but this is not the same thing as a language delay.)
Sometimes, people ask about the pronunciation of words and early stuttering — these are generally not something to worry about.
This data is probably largely reassuring, but it doesn’t answer the question of what you should do if your child is behind these milestones or if you are concerned. The good news is that there are ways to help address this — early intervention has been shown to improve toddler language development. The way into this is through your pediatrician; if you are concerned, you should talk to them. If you are worried that your concerns may be dismissed, this data may help make the point about where you see your child relative to the milestones.
Closing thoughts
Asking ourselves how our kids measure up to milestones and other kids is a natural parenting instinct. We tend to regard early achievement of milestones as a sign that our children may, in fact, be wizards. The CDC milestones are not focused on identifying wizards. They are very sensibly focused on helping find children who might benefit from additional scaffolding and public services.
There is a wide range of normal development, and, by and large, the exact speed of development in these areas has relatively little predictive power for long-term outcomes. So, try not to overthink it.
The bottom line
- Developmental milestones are screening tools, not performance benchmarks; they help identify children who may benefit from early intervention.
- There is wide variability in speech development, especially after 18 months. For example, at 24 months, children may have anywhere from 50 to 500 words and still fall within the distribution.
- Factors like gender and bilingualism can influence the pace of speech development, but slower talking in these cases does not usually indicate a developmental delay.
- Early intervention is very effective at improving language development. If your child is not meeting the milestones or you have any concerns, discuss it with your pediatrician.


Log in