


One Halloween, I came across an Instagram reel with the caption “the scariest costume of all.” The costume, worn by a mom holding a toddler, was a T-shirt silk-screened with an image of a ringing phone. The caller? Day care.
Before kids, I would have said, I don’t get it. After kids, it resonated immediately. I recall one period in which the person who would call when my kids were sick always began with “It’s not an emergency, but …,” which came to feel both reassuring and also like a hammer of doom.
It is no secret that kids get sick frequently in general, and it’s also no secret that those illnesses often come from child care or school settings. Even knowing this, people often have follow-up questions. How often is it really normal for kids to be sick? How significant is child care attendance in driving illness? And, on the more optimistic side, do these early illnesses actually make kids less likely to get sick later?
Why do kids get sick so frequently?
Most illnesses that kids (and adults) get are a result of viral infections. The world contains a lot of viruses — adenoviruses, enteroviruses, coronaviruses, flu viruses, and on and on. Many (not all, but many) of them can make us sick with various symptoms, including respiratory symptoms, gastrointestinal symptoms, and general “unwell” feelings. These viral infections are often mild and usually require only supportive care — extra fluids, rest, Tylenol, or Advil. More serious illness could require a doctor or hospital visit.
Kids get sick more than adults (details below) in large part because they are encountering these viruses for the first time. Even though, in many cases, the same virus can make you sick many times, in most cases, later infections are less serious. A good example of this is RSV, which is very prevalent and most of us are exposed to it every year. The first RSV infections in life are much more likely to lead to serious respiratory symptoms; for older children and adults, it typically presents as just a mild cold.
The lower level of severity for later infections is a result of immune system memory. When it encounters a virus, your immune system makes antibodies. These last a few months, but memory T and B cells are retained for the long term, meaning when you’re exposed to the virus again, your immune system can respond more quickly and you get less sick.
Putting this all together: Child care settings are, for many kids, an important source of early exposure to many new viruses. They get sick because the viruses are new to them.
How often are kids sick, really? (It feels like… a lot.)
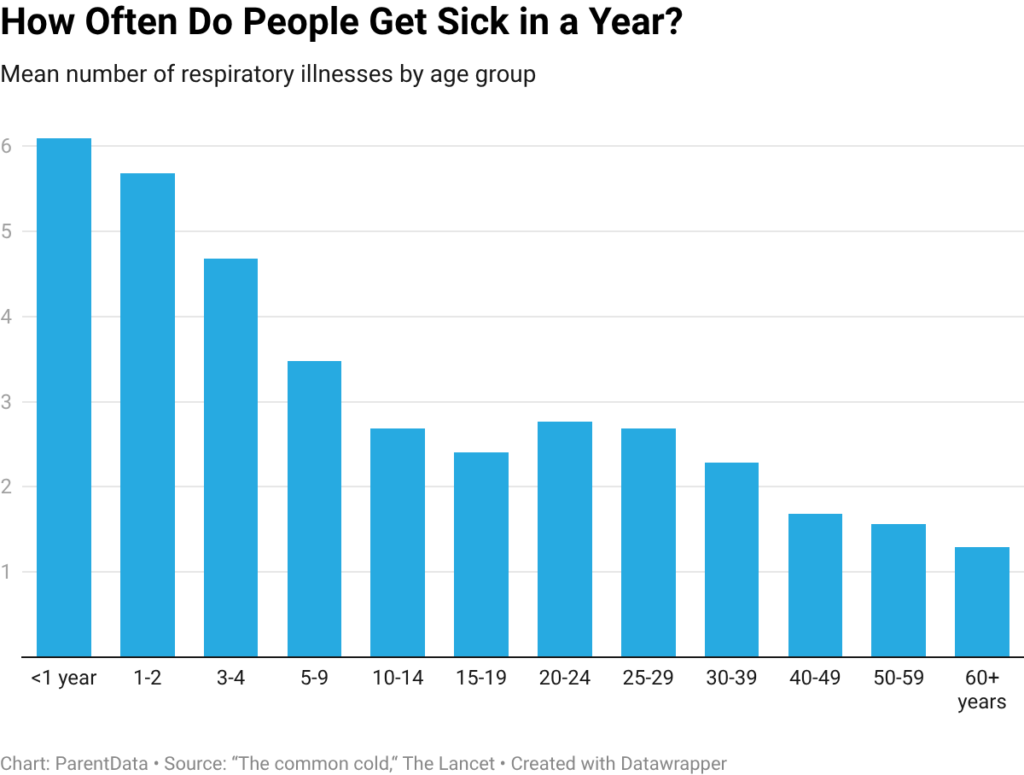
What’s normal? This is a question I get frequently. Especially with little kids in their first winter, it can be astonishing how often they get sick.
This study, begun in 1990 in Germany, recruited a sample of 1,314 children and followed them through the age of 12. Parents were asked to record the number of respiratory viruses children got by year. Between 0 and 2, kids got an average of 3.4 illnesses per year; between 2 and 5, it was 2.6 per year; and between 5 and 12, one per year. These numbers may seem low, but the range was enormous. The authors argue, based on the distribution, that parents and doctors should not be concerned as long as there are fewer than 11 respiratory illnesses per year in the first two years, up to eight in years 2 to 5, and up to four in years 5 to 11.A 2003 review article points to even higher numbers on average — children under 1 having six to eight colds per year, dropping down to two or three per year by later childhood.
It’s important to note that a large share of respiratory viruses occurs in the winter months. When we say up to 11 illnesses in kids under 2, it’s not that these are distributed one per month. It’s 11 mostly in a five-month period, which averages to an illness about every other week during those months. Further, a systematic review of the duration of cold symptoms points to symptoms lasting longer than many people expect. Common cold symptoms averaged 15 days, with a cough averaging 25 days.
It is not just respiratory viruses. Kids also vomit and get diarrhea. Data from the UK shows that among children under 5, 15% have the norovirus every year. A study of children in day care in Denmark showed that half of them got some gastrointestinal illness over a period of six months.
Conclusion: It’s not surprising that some of us feel like our kids are sick constantly. It does improve as they age.
Do kids in day care get sick more often?
Children in child care settings have more illnesses than those who are not. This is visible in many studies. To give one example, a 2002 JAMA Pediatrics paper followed 1,200 children in Tucson, Arizona, starting in 1980. The authors find that children in large child care settings are twice as likely to have frequent colds (more than six per year) as those who are cared for at home; those in smaller home care settings have an intermediate illness level.
In a much larger study of a similar question, researchers in Denmark used a national dataset covering 138,000 hospital admissions for respiratory infections in young children. They find that for children under 1, the first six months of enrollment in child care increases the risk of hospitalization by 70% (keep in mind the levels are low, so the absolute risk is still small). The increase is there, but smaller, for kids who initially enroll at older ages.
A notable feature of this study is that they also observe whether kids have siblings. They find that the impact of child care is much larger for children without older siblings. In general, older siblings are an important source of illness exposure. This study suggests that if you’ve got that exposure already, the impacts of child care are smaller.
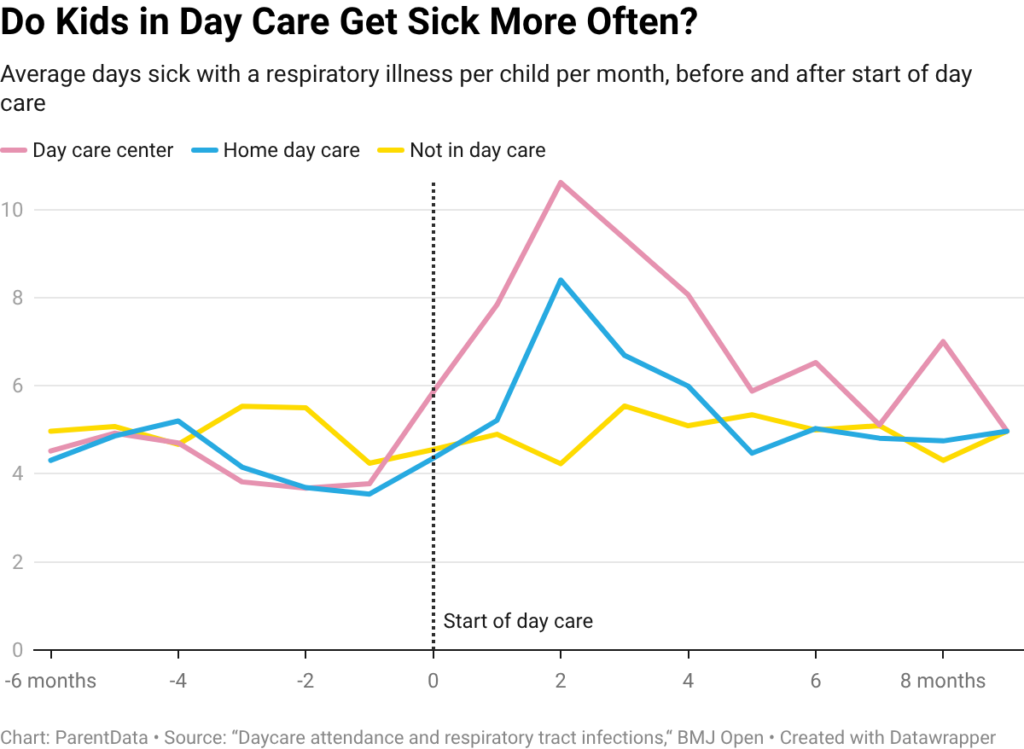
A perhaps reassuring feature of these data is that the spike in illnesses is relatively short-lived. We can see this, for example, in a study of about 1,900 children that followed them over time and mapped out the impact of child care attendance over time. The basic patterns are visible in the graph below. For the first several months after enrollment, illnesses are higher, especially for those in larger child care settings. But by six months after enrollment, the groups are experiencing illness at the same rate. To be clear: kids still get sick. But the kids in child care aren’t getting sick any more than others.
Again, this is focused on respiratory viruses, but data on gastrointestinal illness show a similar elevation in the first year of day care.
Do more illnesses now mean fewer in the future?
Final question: Your child gets sick more in day care, at least at the start. Will you get some of that sickness time back later? Answer: yes.
We can return to that JAMA Pediatrics paper on the kids in Tucson. Those in large child care settings were twice as likely to have frequent colds at age 2. But they were 70% less likely to have frequent colds at 6, and 60% less likely at 11. By 13, the groups equalized. A study in Quebec showed similar results — a higher incidence of illness in the preschool years for those attending child care, but lower in the elementary school years. A third study shows that over the first six years of life, total illness is similar in those who attend day care and those who do not. Day care attendance is associated with having those illnesses at early ages.
This final set of results organizes these findings a bit with the background at the start. Eventually, a child will be exposed to most or all of the common viruses around them. The first time they have exposure to any given virus, it will be worse than later times. For many viruses, this first time is likely to be in the first entry to a child care setting. If that’s child care early in life, that’s where they get the illnesses; if it’s school, they’ll get them then.
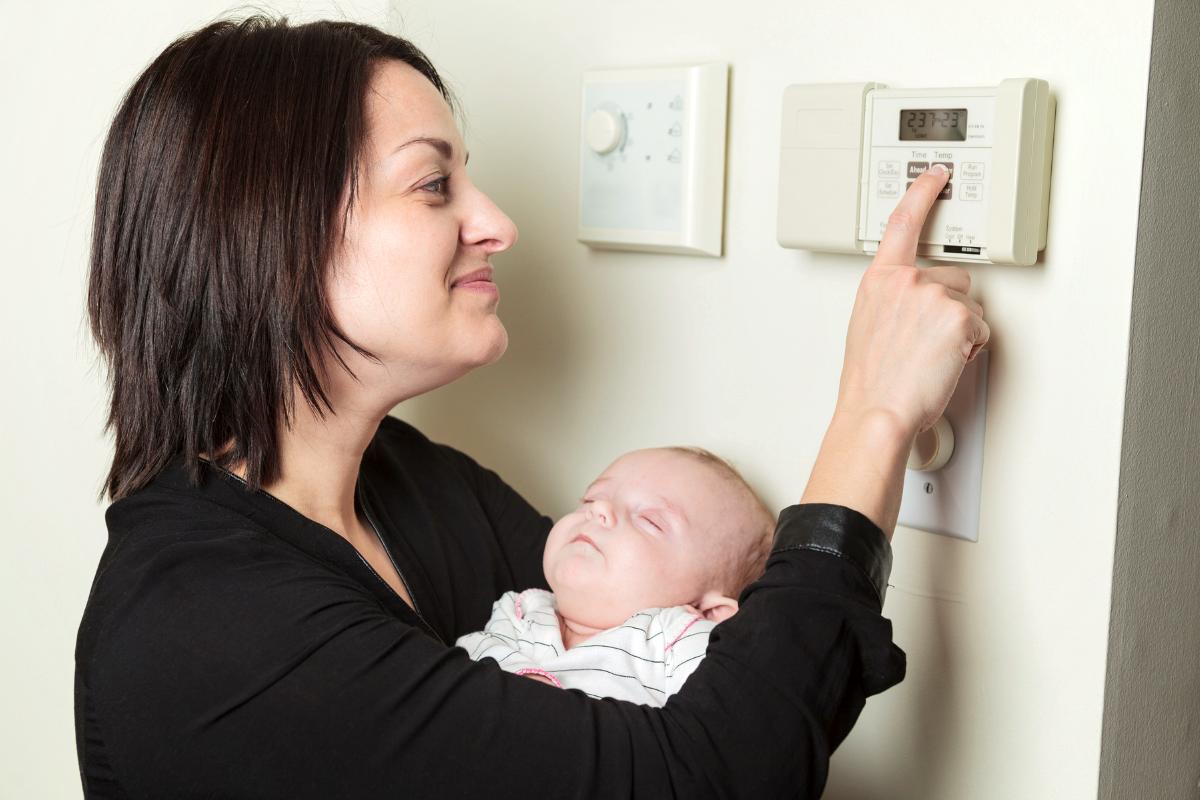
Illness is disruptive. Have a plan.
To return to the Halloween costume we opened with, I think it’s worth pausing on the impacts of illness. Children who go to child care will get sick slightly more often in the first six months — that’s what the data says. But all kids, regardless of care environment, will get sick pretty frequently. It’s part of childhood and part of developing long-term immunity.
These illnesses bite harder at parents when they interfere with a child care solution. If your child is home with a parent or an in-home caregiver, illness is unpleasant but doesn’t necessarily require a change in day-to-day activities. The same cannot be said when a child typically attends out-of-home child care and, therefore, cannot go when they are sick. Even with the same number of illnesses, you’ll feel it more.
Among the best pieces of advice I got when Penelope was born was from my friend Nancy. She said, “Have a plan for what you’ll do when child care melts down.” The morning when your kid wakes up with a fever is a tough time to plan; the more you can figure out in advance, the better.
This might mean thinking about backup child care options, but, as many parents know, that’s often really difficult to find or plan (shout-out to the lucky people with helpful grandparents nearby). More likely, it means having an in-advance conversation — if both parents are working — about how you will prioritize work obligations. When your child is sick, it isn’t the best time to litigate whether your meetings are more important than your partner’s. If you can make some version of a plan in advance (for example, in our house, classroom teaching takes precedence over other things), you can head off a lot of bad feelings.
The bottom line
- Kids in day care get sick more often at first, but over time, it evens out. By elementary school, they may even get sick less than kids who stayed home.
- Every child eventually encounters the common viruses around them, whether in child care, preschool, or school. Illness is part of building immunity.
- Day care illness is disruptive and inevitable. The best strategy is to plan for how your family will handle it — who will stay home, how to prioritize work, and what backup options you may have.


Log in
The study that shows no difference after a year seems to be from Finland where kids start daycare much later than in other countries and where parents are less likely to bring a sick kid to daycare.
What about nonrespiratory illnesses? We’ve had two rounds of vomiting that lasted a week each in the 5 months he’s been at a daycare center. Normal or substandard cleaning practices and care?