Emily Oster

6 min Read Emily Oster

Emily Oster

Why Schools Always Call Moms

Data on inequality in parental workloads

Emily Oster

6 min Read

A few weeks ago, a new working paper (in economics) was released proving definitively what we all know: the school is more likely to call mom than dad.

The paper, which you can see in full here, is the work of three women — Kristy Buzard, Laura Gee, and Olga Stoddard — who I can only assume came up with this idea at least in part because the school always calls them.

(This research, and what I will talk about below, tends to focus on two-person heterosexual relationships. To the extent that we have data on same-sex couples, it does tend to point to a more even distribution of household load. But that data is, unfortunately, more limited.)

The primary results in the paper report on a large-scale field experiment in which the authors sent emails to over 30,000 school principals across the U.S. The emails came from fictitious two-parent heterosexual families, and they indicated that the family was looking for a school for their child, and asked if the principal would call to discuss. The emails provided numbers for both mom and dad, and the researchers were able to see which parent, if any, got a call. (This empirical approach is sometimes called an “audit experiment.”)

The experiment comes in varying the message in terms of how strongly it indicated a preference to call one parent or another. For simplicity, I will focus on only three of the treatments here. It is worth noting that about 80% of the time, there is no call at all (not surprising or unusual in this type of experiment). What the authors focus on is the question of conditional on calling, who gets the call.

The first group of principals gets a baseline treatment: the message said, “Can you call one of us to discuss?” without indicating any preference for either parent. In these cases, 59% of the time when a call is made, it is made to mom. This is significantly higher than would be the case if the principal was randomizing. This result alone affirms the view that moms are more likely to get a call, all else being equal.

A second treatment had a message indicating that the male parent had “a lot of availability” and the female parent did not. In this case, 74% of the time when a call is made, it is to dad; but still, 26% of the time, mom is called. In a parallel third treatment, the message indicated that the female parent had a lot of availability and the male parent did not. In that message, 90% of the time, mom was called. That difference — 74% versus 90% — also gives a sense of gender differences in outreach. If you indicate that mom is more available, they almost always call mom; that’s less true when you indicate dad is available.

The authors of this paper argue — and I agree — that the differences they see are probably the tip of the iceberg, and if they had a way to measure (say) who gets a call when a kid is sick, the differences would be even more extreme. But they also connect their result to a larger point, which is that this is part of the overall gender imbalance in the invisible labor in the household and that, maybe, these issues and issues like them impact equality in the labor market too.

What about household work beyond school calls?

This paper connects to a larger set of issues, which we can measure in data, about household work hours. It is not surprising that, historically, women have done more household work. In a setting in which the male household member is working more hours and contributing more of the income, it may make sense to allocate time in this way. (I’m not saying it’s fair! Just that it has an efficiency value.)

Over time, incomes have become more equal. Notably, though, the time spent on household tasks hasn’t moved to the same extent.

There are a variety of data sources to see this. One is a recent survey out of the Pew Research Center that surveyed couples about their time use and their income. Among other analyses, the researchers classify couples by their relative incomes and then look at how they spend their time.

Pew divided couples into five groups. First, they have what they call egalitarian marriages, where both partners earn between 40% and 60% of the household income. They then have marriages where either the husband or the wife is the primary earner — making more than 60% of the income but not all of the income. And, finally, marriages where only one of the partners works, which they call sole earner marriages.

For each couple, they collect information on their time use: hours spent at work, at leisure, and in caregiving and household work. I will focus here on couples with children. The graph below shows the average hours spent, by each partner, on the combination of caregiving and household work, divided by marriage type.

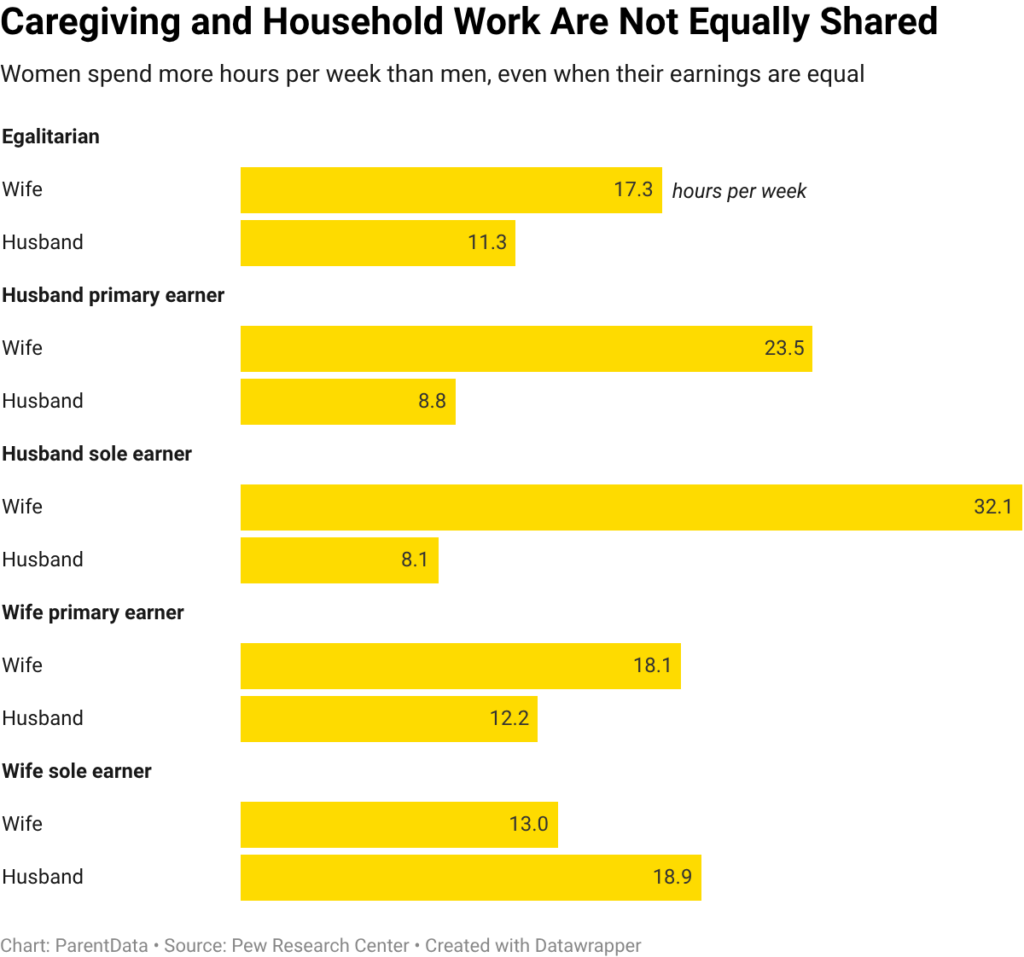
For egalitarian marriages, where both partners earn about the same amount, women do an average of 17.3 hours of caregiving and household work, versus only 11.3 hours for men. This is a statistically significant difference.

Unsurprisingly, when the husband is a primary or sole earner, mom does much more of the household work. When the husband is the sole earner, the female partner does an average of 32 hours of household work and caregiving a week, versus only 8 hours for the male partner.

Most striking, though, are the last set of bars below. What happens when mom is the primary or sole earner? When mom is the primary earner, making more than 60% of the household income, she still does more of the household work — 18.1 versus 12.2 hours. This difference is very similar to what we see when both partners have similar earnings. When the female partner is the sole earner, she does do less housework and caregiving than her partner — 13 versus 18.9 hours — but that difference is much smaller than when the male partner is the sole earner.

Overall, what we see is that women are doing more household work even when earnings are equal. In addition, as women become more important to the economics of the household, they have generally remained the primary providers of household work. This is echoed elsewhere. For example, we can see it in Swedish data that exploits variation over time. A sociology paper from back in 2007 showed that even as spouse earnings have become more similar, the changes in household work allocation have lagged.

Bottom line: across many settings, looked at in many different ways, women are doing a disproportionate share of the caregiving and household work in heterosexual marriages. None of these results seem very surprising, though it may be clarifying to see them in the data in black and white. The real question is what, if anything, one can do about this.

What can we do about gender inequality in household labor?

In an odd way, I think the easiest thing to answer is the institutional question (even if it may be hard to implement changes). It would be great if schools and child care centers would ask parents who should be called first. Every year, at the start of the year, we all fill out a million forms for our school or child care settings. One of those forms should ask who the school should call as a first step. (Then they should listen to that instruction.) This change doesn’t really need to be motivated by a need for household equality, either. It’s just efficient! Calling the parent who will never pick up is not helpful.

What about if we see these patterns in our own families, though? How can we change them? That’s a subject for a much longer post, and, indeed, it’s something I touch on in The Family Firm and that Eve Rodksy’s Fair Play spends an entire book on. Here, I’ll just suggest two questions to start your thinking.

Question 1: Is this a problem for us? 

Not every family and marriage works the same way. It is not necessarily a problem if household work is unbalanced, if it works in your family. In my family, I am the parent who gets the call from the school, who coordinates camp and fills out the school forms. I’m the one who figures out what to do if we need sick coverage and, usually, the one who moves things around to cover. There is plenty of stuff that my spouse does, but I think (I think!) we’d agree that in terms of hours, I spend more time on household work. Despite the fact that we have similar professional profiles and ambitions.

This is what works for my family. It isn’t what would work for everyone, because no one’s family is the same. Therefore, your first question is whether the setup now is working for all of you. If yes, super. If no, go to Question 2.

Question 2: What does each of us want?

If you find that the household work allocation isn’t … working, it’s time to think about a change. This is where I’d really push you to something like Fair Play, which has concrete tools for making these changes. But no matter what tools you look to, you are going to have to start by thinking about what you want in a very concrete way. What would a good allocation look like? There are going to be some steps to get there, but that’s always going to be where to start.

0 Comments
Inline Feedbacks
View all comments
Kids in a classroom play with Montessori-style toys.

8 min read

Is Montessori School Better?

It depends on what you are trying to accomplish

Emily Oster
A parent and child look at a book during a homeschool reading session.

Aug 14 2023

8 min read

Is Homeschooling Worth It?

Of the big decisions we make about our school-age children, perhaps none looms larger than … school. Your child will Read more

Emily Oster
A baby cries on their parent's shoulder during daycare drop-off.

Oct 18 2023

3 min read

What Should I Do About Unbearable Preschool Drop-offs?

Everyone says that starting preschool will be good for my 2-year-old. However, the level of hysterical screaming and sobbing at Read more

Emily Oster
A parent hugs their children during school drop off.

Oct 26 2023

8 min read

How Much Should Parents Help Their Kids With School?

Today’s guest post is from psychologist Dr. Katie Davis, and it’s about how involved we should be in trying to Read more

Katie Davis

Instagram

left right
I hear from many of you that the information on ParentData makes you feel seen. Wherever you are on your journey, it’s always helpful to know you’re not alone. 

Drop an emoji in the comments that best describes your pregnancy or parenting searches lately… 💤🚽🍻🎒💩

I hear from many of you that the information on ParentData makes you feel seen. Wherever you are on your journey, it’s always helpful to know you’re not alone.

Drop an emoji in the comments that best describes your pregnancy or parenting searches lately… 💤🚽🍻🎒💩
...

Milestones. We celebrate them in pregnancy, in parenting, and they’re a fun thing to celebrate at work too. Just a couple years ago I couldn’t have foreseen what this community would grow into. Today, there are over 400,000 of you here—asking questions, making others feel seen wherever they may be in their journey, and sharing information that supports data > panic. 

It has been a busy summer for the team at ParentData. I’d love to take a moment here to celebrate the 400k milestone. As I’ve said before, it’s more important than ever to put good data in the hands of parents. 

Share this post with a friend who could use a little more data, and a little less parenting overwhelm. 

📷 Me and my oldest, collaborating on “Expecting Better”

Milestones. We celebrate them in pregnancy, in parenting, and they’re a fun thing to celebrate at work too. Just a couple years ago I couldn’t have foreseen what this community would grow into. Today, there are over 400,000 of you here—asking questions, making others feel seen wherever they may be in their journey, and sharing information that supports data > panic.

It has been a busy summer for the team at ParentData. I’d love to take a moment here to celebrate the 400k milestone. As I’ve said before, it’s more important than ever to put good data in the hands of parents.

Share this post with a friend who could use a little more data, and a little less parenting overwhelm.

📷 Me and my oldest, collaborating on “Expecting Better”
...

I spend a lot of time talking people down after they read the latest panic headline. In most cases, these articles create an unnecessary amount of stress around pregnancy and parenting. This is my pro tip for understanding whether the risk presented is something you should really be worrying about.

Comment “link” for an article with other tools to help you navigate risk and uncertainty.

#emilyoster #parentdata #riskmanagement #parentstruggles #parentingstruggles
...

Here’s why I think you don’t have to throw away your baby bottles.

Here’s why I think you don’t have to throw away your baby bottles. ...

Drop your toddlers favorite thing right now in the comments—then grab some popcorn.

Original thread source: Reddit @croc_docs

Drop your toddlers favorite thing right now in the comments—then grab some popcorn.

Original thread source: Reddit @croc_docs
...

Just keep wiping.

Just keep wiping. ...

Dr. Gillian Goddard sums up what she learned from the Hot Flash  S e x  Survey! Here are some key data takeaways:

🌶️ Among respondents, the most common s e x u a l frequency was 1 to 2 times per month, followed closely by 1 to 2 times per week
🌶️ 37% have found their sweet spot and are happy with the frequency of s e x they are having
🌶️ About 64% of respondents were very or somewhat satisfied with the quality of the s e x they are having

Do any of these findings surprise you? Let us know in the comments!

#hotflash #intimacy #midlifepleasure #parentdata #relationships

Dr. Gillian Goddard sums up what she learned from the Hot Flash S e x Survey! Here are some key data takeaways:

🌶️ Among respondents, the most common s e x u a l frequency was 1 to 2 times per month, followed closely by 1 to 2 times per week
🌶️ 37% have found their sweet spot and are happy with the frequency of s e x they are having
🌶️ About 64% of respondents were very or somewhat satisfied with the quality of the s e x they are having

Do any of these findings surprise you? Let us know in the comments!

#hotflash #intimacy #midlifepleasure #parentdata #relationships
...

Should your kid be in a car seat on the plane? The AAP recommends that you put kids under 40 pounds into a car seat on airplanes. However, airlines don’t require car seats.

Here’s what we know from a data standpoint:
✈️ The risk of injury to a child on a plane without a carseat is very small (about 1 in 250,000)
✈️ A JAMA Pediatrics paper estimates about 0.4 child air crash deaths per year might be prevented in the U.S. with car seats 
✈️ Cars are far more dangerous than airplanes! The same JAMA paper suggests that if 5% to 10% of families switched to driving, then we would expect more total deaths as a result of this policy. 

If you want to buy a seat for your lap infant, or bring a car seat for an older child, by all means do so! But the additional protection based on the numbers is extremely small.

#parentdata #emilyoster #flyingwithkids #flyingwithbaby #carseats #carseatsafety

Should your kid be in a car seat on the plane? The AAP recommends that you put kids under 40 pounds into a car seat on airplanes. However, airlines don’t require car seats.

Here’s what we know from a data standpoint:
✈️ The risk of injury to a child on a plane without a carseat is very small (about 1 in 250,000)
✈️ A JAMA Pediatrics paper estimates about 0.4 child air crash deaths per year might be prevented in the U.S. with car seats
✈️ Cars are far more dangerous than airplanes! The same JAMA paper suggests that if 5% to 10% of families switched to driving, then we would expect more total deaths as a result of this policy.

If you want to buy a seat for your lap infant, or bring a car seat for an older child, by all means do so! But the additional protection based on the numbers is extremely small.

#parentdata #emilyoster #flyingwithkids #flyingwithbaby #carseats #carseatsafety
...

SLEEP DATA 💤 PART 2: Let’s talk about naps. Comment “Link” for an article on what we learned about daytime sleep!

The first three months of life are a chaotic combination of irregular napping, many naps, and a few brave or lucky souls who appear to have already arrived at a two-to-three nap schedule. Over the next few months, the naps consolidate to three and then to two. By the 10-to-12-month period, a very large share of kids are napping a consistent two naps per day. Over the period between 12 and 18 months, this shifts toward one nap. And then sometime in the range of 3 to 5 years, naps are dropped. What I think is perhaps most useful about this graph is it gives a lot of color to the average napping ages that we often hear. 

Note: Survey data came from the ParentData audience and users of the Nanit sleep monitor system. Both audiences skew higher-education and higher-income than the average, and mostly have younger children. The final sample is 14,919 children. For more insights on our respondents, read the full article.

SLEEP DATA 💤 PART 2: Let’s talk about naps. Comment “Link” for an article on what we learned about daytime sleep!

The first three months of life are a chaotic combination of irregular napping, many naps, and a few brave or lucky souls who appear to have already arrived at a two-to-three nap schedule. Over the next few months, the naps consolidate to three and then to two. By the 10-to-12-month period, a very large share of kids are napping a consistent two naps per day. Over the period between 12 and 18 months, this shifts toward one nap. And then sometime in the range of 3 to 5 years, naps are dropped. What I think is perhaps most useful about this graph is it gives a lot of color to the average napping ages that we often hear.

Note: Survey data came from the ParentData audience and users of the Nanit sleep monitor system. Both audiences skew higher-education and higher-income than the average, and mostly have younger children. The final sample is 14,919 children. For more insights on our respondents, read the full article.
...

Happy Father’s Day to the Fathers and Father figures in our ParentData community! 

Tag a Dad who this holiday may be tricky for. We’re sending you love. 💛

Happy Father’s Day to the Fathers and Father figures in our ParentData community!

Tag a Dad who this holiday may be tricky for. We’re sending you love. 💛
...

“Whilst googling things like ‘new dad sad’ and ‘why am I crying new dad,’ I came across an article written by a doctor who had trouble connecting with his second child. I read the symptoms and felt an odd sense of relief.” Today we’re bringing back an essay by Kevin Maguire of @newfatherhood about his experience with paternal postpartum depression. We need to demystify these issues in order to change things for the better. Comment “Link” for a DM to read his full essay.

#parentdata #postpartum #postpartumdepression #paternalmentalhealth #newparents #emilyoster
...

What does the data say about children who look more like one parent? Do they also inherit more character traits and mannerisms from that parent? Let’s talk about it 🔎

#emilyoster #parentdata #parentingcommunity #lookslikedaddy #lookslikemommy

What does the data say about children who look more like one parent? Do they also inherit more character traits and mannerisms from that parent? Let’s talk about it 🔎

#emilyoster #parentdata #parentingcommunity #lookslikedaddy #lookslikemommy
...

SLEEP DATA 💤 We asked you all about your kids’ sleep—and got nearly 15,000 survey responses to better understand kids’ sleep patterns. Comment “Link” for an article that breaks down our findings!

This graph shows sleeping location by age. You’ll notice that for the first three months, most kids are in their own sleeping location in a parent’s room. Then, over the first year, this switches toward their own room. As kids age, sharing a room with a sibling becomes more common. 

Head to the newsletter for more and stay tuned for part two next week on naps! 🌙

#parentdata #emilyoster #childsleep #babysleep #parentingcommunity

SLEEP DATA 💤 We asked you all about your kids’ sleep—and got nearly 15,000 survey responses to better understand kids’ sleep patterns. Comment “Link” for an article that breaks down our findings!

This graph shows sleeping location by age. You’ll notice that for the first three months, most kids are in their own sleeping location in a parent’s room. Then, over the first year, this switches toward their own room. As kids age, sharing a room with a sibling becomes more common.

Head to the newsletter for more and stay tuned for part two next week on naps! 🌙

#parentdata #emilyoster #childsleep #babysleep #parentingcommunity
...

Weekends are good for extra cups of ☕️ and listening to podcasts. I asked our team how they pod—most people said on walks or during chores. What about you?

Comment “Link” to subscribe to ParentData with Emily Oster, joined by some excellent guests.

#parentdata #parentdatapodcast #parentingpodcast #parentingtips #emilyoster
...