Emily Oster

7 min Read Emily Oster

Emily Oster

Is There a Link Between BMI and Health?

Unpacking the data on weight

Emily Oster

7 min Read

In the past several months, we’ve had a number of posts about weight, food, and health. I interviewed Virginia Sole-Smith about her book Fat Talk: Parenting in the Age of Diet Culture and, separately, I wrote about Ozempic. In response to each of these, we got a lot of feedback and a lot of inquiries. At the top of the question pile was a request to help people better understand the link between BMI, or weight in general, and health.

This question isn’t just an academic one. From an individual standpoint, many people struggle to think about the right health choices — for them and their kids. And for at least some of those people, it’s clear they feel stuck between a message coming out of the medical establishment — lose weight for better health — and messages coming from other angles, arguing that health and size aren’t strongly linked and emphasizing that this link may actually be detrimental.  

This space is complicated from a data standpoint, as you’ll see below, but it’s also an emotionally complicated one. Very few of us have a totally straightforward relationship with food and our bodies. I’ve been reading Cole Kazdin’s new book, What’s Eating Us, which is wonderful and also a stark reminder that eating disorders are, in their various forms, rampant. 

So why write about this at all? As usual, I think data can help, because it can help us see why some groups might want to use a metric like BMI, what it would mean, and to think carefully about whether there is any value. That is what I’m going to try to do today.   

A note: This post will use the words “overweight” and “obesity” because those are used in the scientific literature and have technical meanings. 

And a further note: If this post isn’t for you today, please just skip it. I’ll be back later this week with one on doulas. 


Does BMI measure health? If not, what does it mean? 

I want to start with BMI itself. Stripped of other associations, this is just a number: weight in kilograms divided by height in meters squared. It is one of many ways you could imagine capturing a measure of individual body size. Having a standard metric for something like this can be useful for summarizing population characteristics and comparing across groups.

For example: Let’s say we want to compare the average body sizes for treatment and control groups in a randomized trial. Researchers need a simple way to do this that is consistent across studies. It is best if it doesn’t rely on more complex measurements (like body fat percentage). There are plenty of ways to do this (say, weight in pounds divided by height in feet), but this is the one the medical establishment chose.

Less obviously valuable but possibly still of some use is to divide this into categories. Sometimes we want to capture a feature of a distribution rather than just the average. It may be useful to compare, say, the proportion of people with a BMI over 35 in each of two groups in a study. To make the language more comparable, we can imagine labeling these groups in some way (e.g. BMI Group 1, BMI Group 2). 

Problems arise in these labelings, though — at least two of them. First: the nature of the labels. We’ve grouped and labeled BMI using terms that are not neutral. One could argue this didn’t have to be true, but I think that’s a hard sell. When you label one group “normal weight” and another group “overweight,” it’s difficult to claim neutrality.

A second problem emerges when we start to treat these labels and categories like they mean something. To see why this is, we can look at another example: birth weight. When babies are born, they have a birth weight, quoted in pounds or, in the scientific literature, usually in grams. Babies with very small birth weight are at higher risk for serious complications. At some point, there was a desire to have a way to summarize, at a population level, the share of babies who were in these higher-risk groups. So a convention was adopted: babies below 2,500 grams (about 5.5 pounds) were classified as “low birth weight” and babies below 1,500 grams (3.3 pounds) were classified as “extremely low birth weight.”

It should be obvious that there is no meaningful difference between a baby of 1,499 grams and one that weighs 1,501 grams — two grams is about the weight of a paper clip. These classifications were not designed to do anything other than describe the population in a standard way. And yet: over time, the existence of these cutoffs changed medical practice. In one of my favorite economics papers (see it here), researchers showed that babies born just below the 1,500-gram cutoff got more medical care than those born just above the cutoff and were more likely to survive. This is true even though, on average, higher birth weight increases survival. But because the medical system was reacting as if 1,500 grams actually meant something, they were under-treating babies just above the 1,500-gram cutoff (I wrote a bit more on that paper here).

This is a long digression, but I think it illustrates a general point in medicine, which is that there are a lot of cutoffs for diagnoses that are fairly arbitrary and that we have a tendency to overemphasize. The BMI cutoffs are similar. There is nothing magical about moving from a BMI of 24.9 to a BMI of 25.1. And by focusing on that, we may ignore other signs we should be paying attention to.

Bottom line: In my view, there is little reason to focus on BMI in individual care situations, and even less reason to get obsessed with cutoffs between BMI categories.

Thinking more broadly about weight and health

If we accept that BMI is just a number, and thinking in terms of categorical cutoffs is not useful, this leads to a second question. Is there a link between weight and health at all? That is, is a measure like BMI a signal (albeit an imperfect one) or is it just noise?

The simplest way to ask this is to look at the relationship between body size and health. We can take some metrics of health that we know to be related to morbidity and mortality and ask to what extent they reflect weight. For simplicity, I’m going to focus on two: high blood pressure and diabetes.

To do this analysis, I pulled data from the National Health and Nutrition Examination Survey, or NHANES, which is a nationally representative survey that collects data on many metrics of health. It’s a good data set for this type of analysis because it does not rely on self-reports for weight and health.

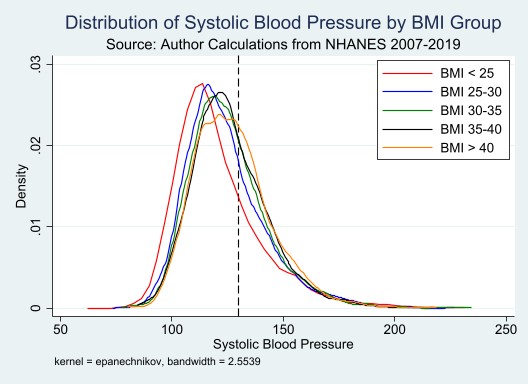
Let’s start with blood pressure. The graph below shows (using my calculations in the NHANES data) the distribution of systolic blood pressure for varying BMI groups. The dotted vertical line is at 130, the cutoff for a diagnosis of any hypertension. There is both signal and noise here. On average, blood pressure is higher for individuals with a higher BMI. But: the distributions overlap to a very great extent. There are plenty of people with a BMI below 25 who have high blood pressure, and plenty of people with a BMI over 40 who have normal blood pressure. (To be slightly more technical and precise: in a regression of systolic blood pressure on integer BMI measures, the R-squared is 0.019.)

Chart showing distribution of systolic blood pressure by BMI group

Turning to diabetes, the graph below shows the share of the population with diagnosed Type 2 diabetes by BMI group. Again, we see both signal and noise. Groups with higher BMI have a higher share of diabetes diagnoses. But also: among those with a BMI less than 25, diabetes diagnoses still occur in 6% of people, and among those with a BMI greater than 40, still only about a quarter report a Type 2 diabetes diagnosis.


We can see sources of some of this noise in the data. The graph below shows diabetes diagnosis rates by BMI group, separated into those who reported vigorous exercise in the past week versus those who did not. What is notable here is the protective effect of exercise. People with a BMI over 40 who report vigorous weekly exercise have diabetes rates similar to those with a much lower BMI with no exercise.


One argument that is sometimes made here is that the metric used is simply BMI but that other measures of body size — notably, waist circumference — are more predictive of health. It is absolutely true in the data that waist circumference has a stronger correlation with health. But the data is also very noisy.

Putting this all together, I see a moderate path. It is hard to look at the data and not conclude that body size, however you measure it, has a correlation with health outcomes. And everything we know biologically about metabolic health suggests there is a causal component. It is implausible to suggest that a larger body size is not a risk factor for diabetes, for example.

At the same time: presuming health — even metabolic health — based on a body size measure is subject to enormous error. Assuming that someone has serious health issues just because they are in a higher-BMI category will not be right and, similarly, assuming they do not have health issues in this category because they are in a lower-BMI category is also wrong.

So I guess everyone is both right and wrong, as usual.

A final thought (and a shout-out to Martinus Evans)

I want to pause a minute on the last graph. In a sense, underlying all the push to lose weight is the weight gradient in that graph. Health is worse at higher BMI, on average, and someone with a BMI of 40 is going to be told a version of Look at how much lower your diabetes risk would be if your BMI was 27. Go out there and lose weight. And we know, from a million studies of diet, that in almost all cases that will not happen, because weight loss at that scale (or really at all) is extremely difficult.

What if instead we looked at that graph and saw that the same decline in risk could be accomplished by adding exercise? In the graph, we’re just seeing a correlation, but there is quite a lot of randomized evidence on the value of some exercise for health, even moderate exercise like vigorous walking. You do not need to run many miles every day for these benefits. An after-lunch walk that gets your heart rate up a few times a week — that’s a start, and a good one.

I wonder if we’d be better off if we didn’t focus on weight at all, and instead got more focused on making exercise achievable and welcoming to everyone. We have work to do on this front. Time and space for exercise are not equitable, and too often people in larger bodies are made to feel excluded from sports. But I wonder if we spent as much time on this as we do on encouraging people to diet, we might make progress.

Inspirational weight-loss stories have always been popular (I’m looking at you, People magazine). Perhaps we could lean out on those and lean in on inspirational exercise, as in this amazing article about Martinus Evans.

0 Comments
Inline Feedbacks
View all comments
A medical exam table is seen with a folded hospital gown and paper sheet.

Mar 17 2023

3 min read

Do I Really Need to Lose Weight While Pregnant?

I’m pregnant and it’s my first. I’m really excited, but I’m struggling with a lot of anxiety because of my Read more

Emily Oster
An overhead view of a clear glass digital scale on a white background.

Aug 02 2023

3 min read

What Does the Research Say About Weight Gain During Pregnancy

I am pregnant with my second child and was recently told by my provider at 34 weeks that I need Read more

Emily Oster
A group of babies listening to ParentData on headphones

Apr 23 2023

29 min read

How to Talk to Kids About Diets, Weight, and Food

I heard about Virginia Sole-Smith’s new book, Fat Talk: Parenting in the Age of Diet Culture, a few months ago and Read more

Emily Oster
Parent gives child a birthday cake

Dec 07 2023

8 min read

Parenting and Eating Disorders

I’m delighted today to have a post by Cole Kazdin, the author of What’s Eating Us, about managing parenting amid Read more

Cole Kazdin

Instagram

left right
I hear from many of you that the information on ParentData makes you feel seen. Wherever you are on your journey, it’s always helpful to know you’re not alone. 

Drop an emoji in the comments that best describes your pregnancy or parenting searches lately… 💤🚽🍻🎒💩

I hear from many of you that the information on ParentData makes you feel seen. Wherever you are on your journey, it’s always helpful to know you’re not alone.

Drop an emoji in the comments that best describes your pregnancy or parenting searches lately… 💤🚽🍻🎒💩
...

Milestones. We celebrate them in pregnancy, in parenting, and they’re a fun thing to celebrate at work too. Just a couple years ago I couldn’t have foreseen what this community would grow into. Today, there are over 400,000 of you here—asking questions, making others feel seen wherever they may be in their journey, and sharing information that supports data > panic. 

It has been a busy summer for the team at ParentData. I’d love to take a moment here to celebrate the 400k milestone. As I’ve said before, it’s more important than ever to put good data in the hands of parents. 

Share this post with a friend who could use a little more data, and a little less parenting overwhelm. 

📷 Me and my oldest, collaborating on “Expecting Better”

Milestones. We celebrate them in pregnancy, in parenting, and they’re a fun thing to celebrate at work too. Just a couple years ago I couldn’t have foreseen what this community would grow into. Today, there are over 400,000 of you here—asking questions, making others feel seen wherever they may be in their journey, and sharing information that supports data > panic.

It has been a busy summer for the team at ParentData. I’d love to take a moment here to celebrate the 400k milestone. As I’ve said before, it’s more important than ever to put good data in the hands of parents.

Share this post with a friend who could use a little more data, and a little less parenting overwhelm.

📷 Me and my oldest, collaborating on “Expecting Better”
...

I spend a lot of time talking people down after they read the latest panic headline. In most cases, these articles create an unnecessary amount of stress around pregnancy and parenting. This is my pro tip for understanding whether the risk presented is something you should really be worrying about.

Comment “link” for an article with other tools to help you navigate risk and uncertainty.

#emilyoster #parentdata #riskmanagement #parentstruggles #parentingstruggles
...

Here’s why I think you don’t have to throw away your baby bottles.

Here’s why I think you don’t have to throw away your baby bottles. ...

Drop your toddlers favorite thing right now in the comments—then grab some popcorn.

Original thread source: Reddit @croc_docs

Drop your toddlers favorite thing right now in the comments—then grab some popcorn.

Original thread source: Reddit @croc_docs
...

Just keep wiping.

Just keep wiping. ...

Dr. Gillian Goddard sums up what she learned from the Hot Flash  S e x  Survey! Here are some key data takeaways:

🌶️ Among respondents, the most common s e x u a l frequency was 1 to 2 times per month, followed closely by 1 to 2 times per week
🌶️ 37% have found their sweet spot and are happy with the frequency of s e x they are having
🌶️ About 64% of respondents were very or somewhat satisfied with the quality of the s e x they are having

Do any of these findings surprise you? Let us know in the comments!

#hotflash #intimacy #midlifepleasure #parentdata #relationships

Dr. Gillian Goddard sums up what she learned from the Hot Flash S e x Survey! Here are some key data takeaways:

🌶️ Among respondents, the most common s e x u a l frequency was 1 to 2 times per month, followed closely by 1 to 2 times per week
🌶️ 37% have found their sweet spot and are happy with the frequency of s e x they are having
🌶️ About 64% of respondents were very or somewhat satisfied with the quality of the s e x they are having

Do any of these findings surprise you? Let us know in the comments!

#hotflash #intimacy #midlifepleasure #parentdata #relationships
...

Should your kid be in a car seat on the plane? The AAP recommends that you put kids under 40 pounds into a car seat on airplanes. However, airlines don’t require car seats.

Here’s what we know from a data standpoint:
✈️ The risk of injury to a child on a plane without a carseat is very small (about 1 in 250,000)
✈️ A JAMA Pediatrics paper estimates about 0.4 child air crash deaths per year might be prevented in the U.S. with car seats 
✈️ Cars are far more dangerous than airplanes! The same JAMA paper suggests that if 5% to 10% of families switched to driving, then we would expect more total deaths as a result of this policy. 

If you want to buy a seat for your lap infant, or bring a car seat for an older child, by all means do so! But the additional protection based on the numbers is extremely small.

#parentdata #emilyoster #flyingwithkids #flyingwithbaby #carseats #carseatsafety

Should your kid be in a car seat on the plane? The AAP recommends that you put kids under 40 pounds into a car seat on airplanes. However, airlines don’t require car seats.

Here’s what we know from a data standpoint:
✈️ The risk of injury to a child on a plane without a carseat is very small (about 1 in 250,000)
✈️ A JAMA Pediatrics paper estimates about 0.4 child air crash deaths per year might be prevented in the U.S. with car seats
✈️ Cars are far more dangerous than airplanes! The same JAMA paper suggests that if 5% to 10% of families switched to driving, then we would expect more total deaths as a result of this policy.

If you want to buy a seat for your lap infant, or bring a car seat for an older child, by all means do so! But the additional protection based on the numbers is extremely small.

#parentdata #emilyoster #flyingwithkids #flyingwithbaby #carseats #carseatsafety
...

SLEEP DATA 💤 PART 2: Let’s talk about naps. Comment “Link” for an article on what we learned about daytime sleep!

The first three months of life are a chaotic combination of irregular napping, many naps, and a few brave or lucky souls who appear to have already arrived at a two-to-three nap schedule. Over the next few months, the naps consolidate to three and then to two. By the 10-to-12-month period, a very large share of kids are napping a consistent two naps per day. Over the period between 12 and 18 months, this shifts toward one nap. And then sometime in the range of 3 to 5 years, naps are dropped. What I think is perhaps most useful about this graph is it gives a lot of color to the average napping ages that we often hear. 

Note: Survey data came from the ParentData audience and users of the Nanit sleep monitor system. Both audiences skew higher-education and higher-income than the average, and mostly have younger children. The final sample is 14,919 children. For more insights on our respondents, read the full article.

SLEEP DATA 💤 PART 2: Let’s talk about naps. Comment “Link” for an article on what we learned about daytime sleep!

The first three months of life are a chaotic combination of irregular napping, many naps, and a few brave or lucky souls who appear to have already arrived at a two-to-three nap schedule. Over the next few months, the naps consolidate to three and then to two. By the 10-to-12-month period, a very large share of kids are napping a consistent two naps per day. Over the period between 12 and 18 months, this shifts toward one nap. And then sometime in the range of 3 to 5 years, naps are dropped. What I think is perhaps most useful about this graph is it gives a lot of color to the average napping ages that we often hear.

Note: Survey data came from the ParentData audience and users of the Nanit sleep monitor system. Both audiences skew higher-education and higher-income than the average, and mostly have younger children. The final sample is 14,919 children. For more insights on our respondents, read the full article.
...

Happy Father’s Day to the Fathers and Father figures in our ParentData community! 

Tag a Dad who this holiday may be tricky for. We’re sending you love. 💛

Happy Father’s Day to the Fathers and Father figures in our ParentData community!

Tag a Dad who this holiday may be tricky for. We’re sending you love. 💛
...

“Whilst googling things like ‘new dad sad’ and ‘why am I crying new dad,’ I came across an article written by a doctor who had trouble connecting with his second child. I read the symptoms and felt an odd sense of relief.” Today we’re bringing back an essay by Kevin Maguire of @newfatherhood about his experience with paternal postpartum depression. We need to demystify these issues in order to change things for the better. Comment “Link” for a DM to read his full essay.

#parentdata #postpartum #postpartumdepression #paternalmentalhealth #newparents #emilyoster
...

What does the data say about children who look more like one parent? Do they also inherit more character traits and mannerisms from that parent? Let’s talk about it 🔎

#emilyoster #parentdata #parentingcommunity #lookslikedaddy #lookslikemommy

What does the data say about children who look more like one parent? Do they also inherit more character traits and mannerisms from that parent? Let’s talk about it 🔎

#emilyoster #parentdata #parentingcommunity #lookslikedaddy #lookslikemommy
...

SLEEP DATA 💤 We asked you all about your kids’ sleep—and got nearly 15,000 survey responses to better understand kids’ sleep patterns. Comment “Link” for an article that breaks down our findings!

This graph shows sleeping location by age. You’ll notice that for the first three months, most kids are in their own sleeping location in a parent’s room. Then, over the first year, this switches toward their own room. As kids age, sharing a room with a sibling becomes more common. 

Head to the newsletter for more and stay tuned for part two next week on naps! 🌙

#parentdata #emilyoster #childsleep #babysleep #parentingcommunity

SLEEP DATA 💤 We asked you all about your kids’ sleep—and got nearly 15,000 survey responses to better understand kids’ sleep patterns. Comment “Link” for an article that breaks down our findings!

This graph shows sleeping location by age. You’ll notice that for the first three months, most kids are in their own sleeping location in a parent’s room. Then, over the first year, this switches toward their own room. As kids age, sharing a room with a sibling becomes more common.

Head to the newsletter for more and stay tuned for part two next week on naps! 🌙

#parentdata #emilyoster #childsleep #babysleep #parentingcommunity
...

Weekends are good for extra cups of ☕️ and listening to podcasts. I asked our team how they pod—most people said on walks or during chores. What about you?

Comment “Link” to subscribe to ParentData with Emily Oster, joined by some excellent guests.

#parentdata #parentdatapodcast #parentingpodcast #parentingtips #emilyoster
...