Emily Oster

7 min Read Emily Oster

Emily Oster

How Long Does It Take to Get Pregnant?

Emily Oster

7 min Read

When we are struggling with something new — and there always seems to be something new to struggle with in pregnancy and parenting — there is tremendous solace in knowing we are not alone. When your child refuses to poop in the toilet, it is extremely reassuring to know that you are not alone and that, in fact, this is so common it has a name (“stool toileting refusal”). This knowledge can be reassuring even when there is nothing that you can do about the problem.

This shared experience can be generated by anecdote — by individual stories — which is part of what we try to do on Tuesdays in this newsletter. For me, though, it’s also generated by data. In these moments, I crave the reassurance of data, of knowing how unusual (or not) my experience is.

In some areas, the world of research delivers for me on this. But in others, it really does not. In the space of conception and pregnancy, we do an okay job when we have information that is collected as part of medical records. But as soon as we move into questions that aren’t in your medical records, questions that are more about experience, the data environment collapses.

Today’s topic is an example. I found myself pondering some reader questions the other day about time to pregnancy. How long does it typically take? If you got pregnant fast the first time, would it be fast the second? Faster? Slower? Did your age matter? In perusing the literature, I found that there was very little that would help me answer these questions.

So I decided to see if I could learn something more by asking all of you; it is your answers I’ll report on today.

I want to be clear, though, on the limits to this approach. The ideal way to answer these questions would be a large nationally (or internationally!) representative study. Instead, this is a convenience sampling survey, meaning I surveyed the people who it was convenient to study.

Properly, then, I think of this as somewhere in the space between anecdote and research. It’s based on thousands of people, and the questions were asked in a way that let us look at them with numbers. But the New England Journal of Medicine is not coming to call for the results. Still: I am hoping that the numerical quantification of this shared experience is helpful.

With that long wind-up, here we go. The survey I did was quite focused, so I’ll surface just two sets of results. The first is about time to pregnancy, how it varies, and how correlated it is. Second, I’ll talk about pregnancy termination and loss.

Basic survey facts 

In a research paper, this would be the methods section.

I surveyed 18,638 individuals, recruited through this newsletter, Instagram, and word of mouth. The sample included people with at least one pregnancy and did not include conceptions through IVF.

Survey participants were asked, for each pregnancy: their age at the time of pregnancy,  whether they were trying to conceive, how long it took (if they were trying), and the pregnancy outcome. Note, I did not ask any demographic questions (e.g. race, education).

Time to pregnancy

Of the total of 37,160 pregnancies recorded by survey participants, 87% were conceptions where people reported they were trying to conceive. I did not ask “how hard” people were trying, so this is likely to be a range from “I went off the pill and we decided to just see what happened” up to “I took 30 ovulation tests every month and timed sex to the minute.”

Among the 32,414 pregnancies in the study for which people were trying to conceive, the average time to conception was 3.9 months. It is important to note that since this data includes successful conceptions, it shouldn’t be taken as measuring the average time to conception for all people.

Average time to conception varied by age and by which pregnancy. The graphs below show average conception time for age groups and based on the pregnancy number (note: these are only for people who reported trying to conceive).

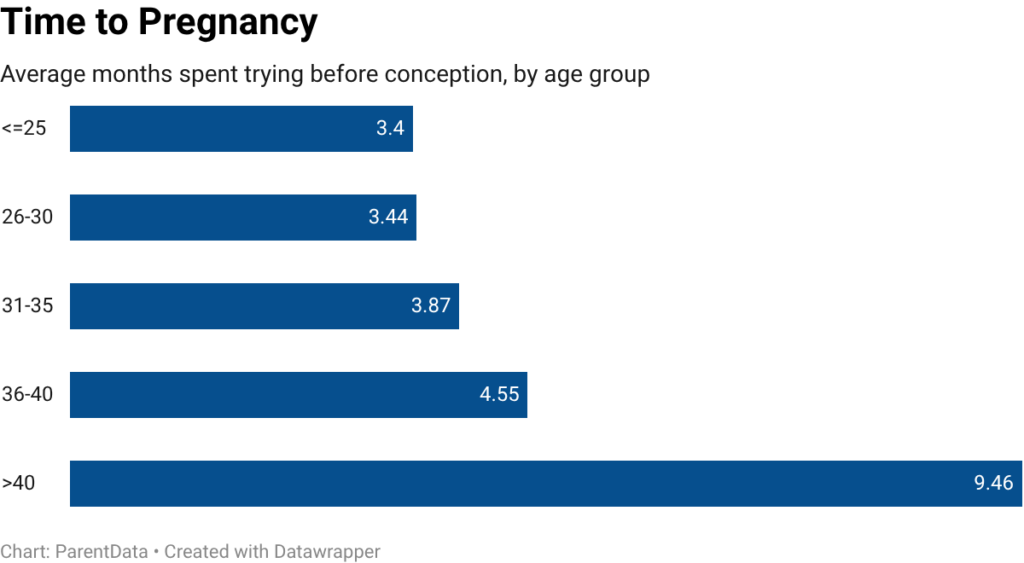
Unsurprisingly, older people take longer to conceive (they are also less likely to be successful, which isn’t captured here). Later pregnancies tend to be conceived faster; this is true overall, and even taking into account older age. This fact, however, is a little hard to interpret. Since among the people with one pregnancy, only a subset have more than one, this isn’t the answer to whether conception is faster later.

To look at that, I looked within people. Beginning with people who have at least two (intended) pregnancies: the first pregnancy conception time was an average of 4.2 months, and the second pregnancy was 3.3 months. For those with at least three (intended) pregnancies, the averages are: 4.1, 3.3, and 3.2 months.

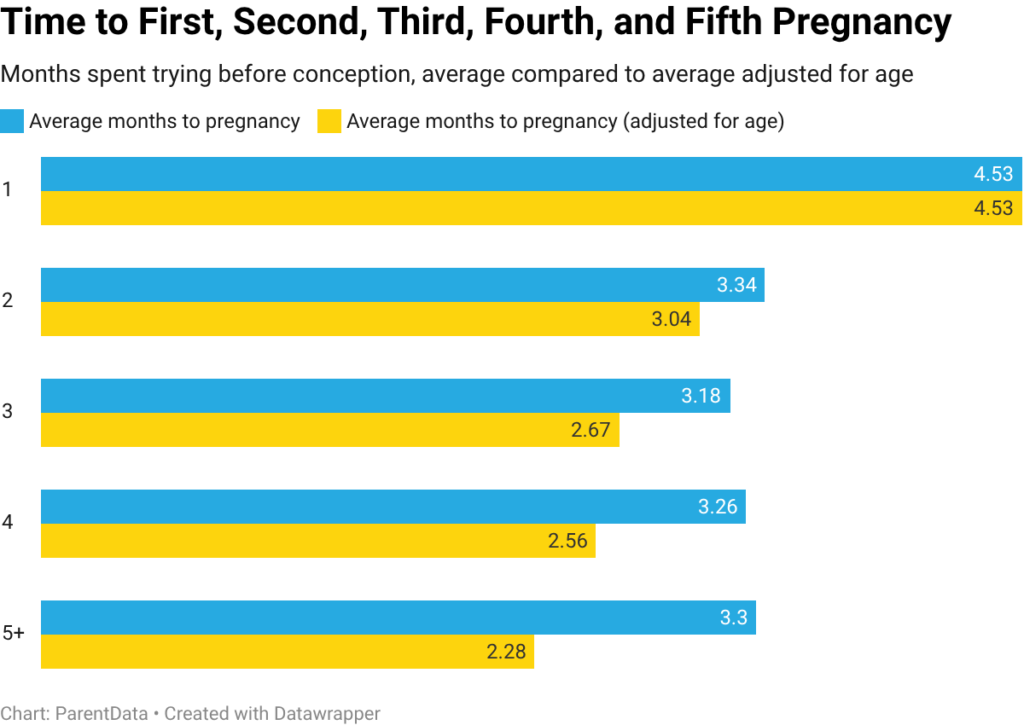
So, on average, later conceptions are slightly faster.

There is also a strong correlation in time to pregnancy across pregnancies, but it is by no means perfect. One way to see this is in the graph below, which illustrates the distribution of time to second pregnancy for women who reported varying times to conceive the first pregnancy.

Conception is on average faster for women who report conceiving the first pregnancy more quickly, but there is a lot of overlap in the distributions. Some women who get pregnant in the first month the first time take many months to conceive a second; on the flip side, among women who report taking more than three months to conceive the first pregnancy, almost 30% conceive a second pregnancy in the first month of trying.

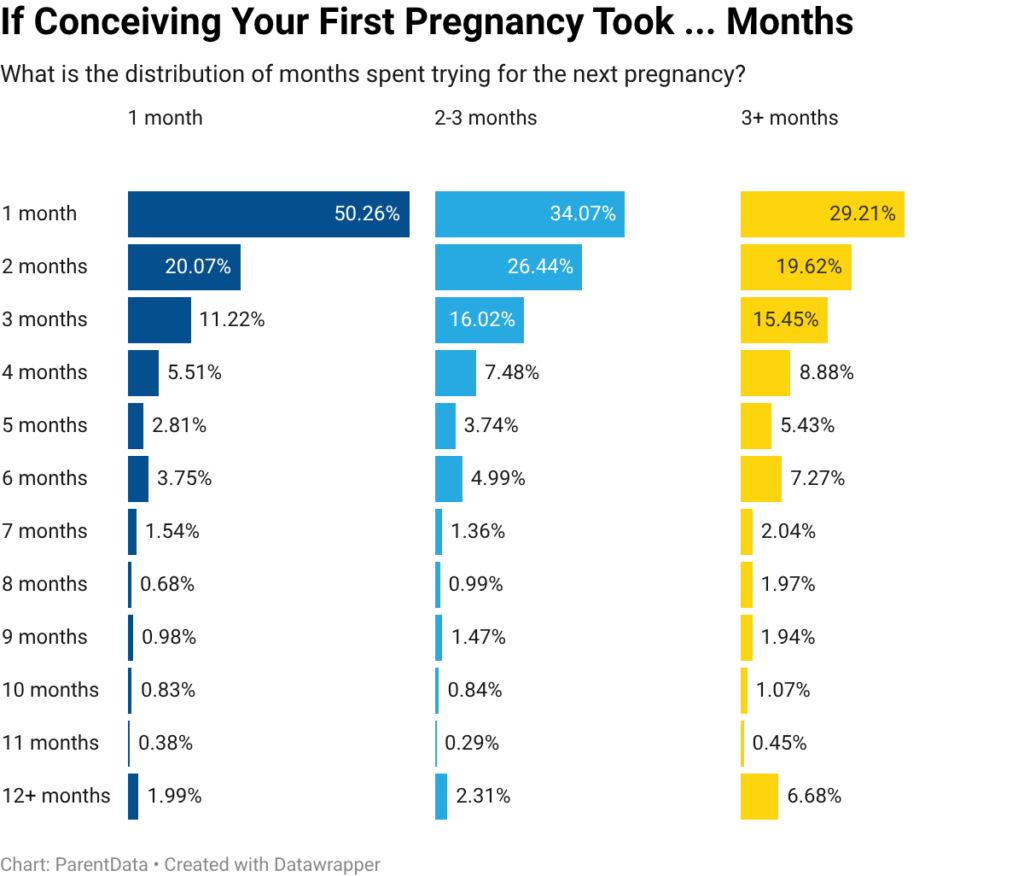
Another way to say this: time to first pregnancy only explains about 11% of the variation in time to second pregnancy.

Pregnancy loss and pregnancy termination

I also asked in this survey about pregnancy outcomes, including losses. These experiences can feel so incredibly lonely, which is all the worse when you realize how widely shared they are.

Among the 18,638 responses to the survey, 26% reported at least one miscarriage, 0.5% reported at least one stillbirth, and 6.5% reported at least one abortion.

Among women with at least one live born child, 27% reported at least one miscarriage, either before or after a first child. Of those women who reported a miscarriage in their first pregnancy, 85% had gone on to have children in later pregnancies.

Miscarriage rates were higher at older ages, and abortions were more common at younger ages, but all of these happened throughout the age groups. The youngest miscarriage age was 13; the oldest, 45. The youngest age for an abortion was 14; the oldest, 44.

The bottom line

  • Among people with multiple pregnancies, time to pregnancy is shorter in later conceptions. This is true even within a person: the average person with two pregnancies will have a shorter time to conception with the second than with the first.
  • Time to a first pregnancy is predictive of the time to a second pregnancy, but this prediction is fairly weak. There is a lot of remaining unexplained variation.

To go back to the start here — when we embark on pregnancy and parenting, it is easy to feel alone. And this is especially true in the very hardest moments. But you’re not. Even in those moments, you are not alone.

A close-up of foaming water in a hot tub.

Sep 30 2022

2 min read

How Bad Is It to Use a Hot Tub While Trying to Conceive?

Ask ParentData

Emily Oster
Covid-19 rapid antigen tests arranged in a pattern on a yellow background.

Mar 12 2020

2 min read

Should I Stop Trying to Conceive?

#1 Question

Emily Oster
Sticky honey drips across a white background.

May 05 2023

3 min read

How Can I Prepare for Glucose Testing?

Hi Emily, I’m wondering if you can demystify glucose testing for gestational diabetes. I had my one-hour glucose challenge test Read more

Emily Oster
An image of a pin in a calendar marking the day to try to conceive.

Sep 13 2023

2 min read

Low Libido and Trying to Concieve

My husband and I are trying to conceive, but he has a low libido. Is it enough to track ovulation Read more

Emily Oster

Instagram

left right
I hear from many of you that the information on ParentData makes you feel seen. Wherever you are on your journey, it’s always helpful to know you’re not alone. 

Drop an emoji in the comments that best describes your pregnancy or parenting searches lately… 💤🚽🍻🎒💩

I hear from many of you that the information on ParentData makes you feel seen. Wherever you are on your journey, it’s always helpful to know you’re not alone.

Drop an emoji in the comments that best describes your pregnancy or parenting searches lately… 💤🚽🍻🎒💩
...

Milestones. We celebrate them in pregnancy, in parenting, and they’re a fun thing to celebrate at work too. Just a couple years ago I couldn’t have foreseen what this community would grow into. Today, there are over 400,000 of you here—asking questions, making others feel seen wherever they may be in their journey, and sharing information that supports data > panic. 

It has been a busy summer for the team at ParentData. I’d love to take a moment here to celebrate the 400k milestone. As I’ve said before, it’s more important than ever to put good data in the hands of parents. 

Share this post with a friend who could use a little more data, and a little less parenting overwhelm. 

📷 Me and my oldest, collaborating on “Expecting Better”

Milestones. We celebrate them in pregnancy, in parenting, and they’re a fun thing to celebrate at work too. Just a couple years ago I couldn’t have foreseen what this community would grow into. Today, there are over 400,000 of you here—asking questions, making others feel seen wherever they may be in their journey, and sharing information that supports data > panic.

It has been a busy summer for the team at ParentData. I’d love to take a moment here to celebrate the 400k milestone. As I’ve said before, it’s more important than ever to put good data in the hands of parents.

Share this post with a friend who could use a little more data, and a little less parenting overwhelm.

📷 Me and my oldest, collaborating on “Expecting Better”
...

I spend a lot of time talking people down after they read the latest panic headline. In most cases, these articles create an unnecessary amount of stress around pregnancy and parenting. This is my pro tip for understanding whether the risk presented is something you should really be worrying about.

Comment “link” for an article with other tools to help you navigate risk and uncertainty.

#emilyoster #parentdata #riskmanagement #parentstruggles #parentingstruggles
...

Here’s why I think you don’t have to throw away your baby bottles.

Here’s why I think you don’t have to throw away your baby bottles. ...

Drop your toddlers favorite thing right now in the comments—then grab some popcorn.

Original thread source: Reddit @croc_docs

Drop your toddlers favorite thing right now in the comments—then grab some popcorn.

Original thread source: Reddit @croc_docs
...

Just keep wiping.

Just keep wiping. ...

Dr. Gillian Goddard sums up what she learned from the Hot Flash  S e x  Survey! Here are some key data takeaways:

🌶️ Among respondents, the most common s e x u a l frequency was 1 to 2 times per month, followed closely by 1 to 2 times per week
🌶️ 37% have found their sweet spot and are happy with the frequency of s e x they are having
🌶️ About 64% of respondents were very or somewhat satisfied with the quality of the s e x they are having

Do any of these findings surprise you? Let us know in the comments!

#hotflash #intimacy #midlifepleasure #parentdata #relationships

Dr. Gillian Goddard sums up what she learned from the Hot Flash S e x Survey! Here are some key data takeaways:

🌶️ Among respondents, the most common s e x u a l frequency was 1 to 2 times per month, followed closely by 1 to 2 times per week
🌶️ 37% have found their sweet spot and are happy with the frequency of s e x they are having
🌶️ About 64% of respondents were very or somewhat satisfied with the quality of the s e x they are having

Do any of these findings surprise you? Let us know in the comments!

#hotflash #intimacy #midlifepleasure #parentdata #relationships
...

Should your kid be in a car seat on the plane? The AAP recommends that you put kids under 40 pounds into a car seat on airplanes. However, airlines don’t require car seats.

Here’s what we know from a data standpoint:
✈️ The risk of injury to a child on a plane without a carseat is very small (about 1 in 250,000)
✈️ A JAMA Pediatrics paper estimates about 0.4 child air crash deaths per year might be prevented in the U.S. with car seats 
✈️ Cars are far more dangerous than airplanes! The same JAMA paper suggests that if 5% to 10% of families switched to driving, then we would expect more total deaths as a result of this policy. 

If you want to buy a seat for your lap infant, or bring a car seat for an older child, by all means do so! But the additional protection based on the numbers is extremely small.

#parentdata #emilyoster #flyingwithkids #flyingwithbaby #carseats #carseatsafety

Should your kid be in a car seat on the plane? The AAP recommends that you put kids under 40 pounds into a car seat on airplanes. However, airlines don’t require car seats.

Here’s what we know from a data standpoint:
✈️ The risk of injury to a child on a plane without a carseat is very small (about 1 in 250,000)
✈️ A JAMA Pediatrics paper estimates about 0.4 child air crash deaths per year might be prevented in the U.S. with car seats
✈️ Cars are far more dangerous than airplanes! The same JAMA paper suggests that if 5% to 10% of families switched to driving, then we would expect more total deaths as a result of this policy.

If you want to buy a seat for your lap infant, or bring a car seat for an older child, by all means do so! But the additional protection based on the numbers is extremely small.

#parentdata #emilyoster #flyingwithkids #flyingwithbaby #carseats #carseatsafety
...

SLEEP DATA 💤 PART 2: Let’s talk about naps. Comment “Link” for an article on what we learned about daytime sleep!

The first three months of life are a chaotic combination of irregular napping, many naps, and a few brave or lucky souls who appear to have already arrived at a two-to-three nap schedule. Over the next few months, the naps consolidate to three and then to two. By the 10-to-12-month period, a very large share of kids are napping a consistent two naps per day. Over the period between 12 and 18 months, this shifts toward one nap. And then sometime in the range of 3 to 5 years, naps are dropped. What I think is perhaps most useful about this graph is it gives a lot of color to the average napping ages that we often hear. 

Note: Survey data came from the ParentData audience and users of the Nanit sleep monitor system. Both audiences skew higher-education and higher-income than the average, and mostly have younger children. The final sample is 14,919 children. For more insights on our respondents, read the full article.

SLEEP DATA 💤 PART 2: Let’s talk about naps. Comment “Link” for an article on what we learned about daytime sleep!

The first three months of life are a chaotic combination of irregular napping, many naps, and a few brave or lucky souls who appear to have already arrived at a two-to-three nap schedule. Over the next few months, the naps consolidate to three and then to two. By the 10-to-12-month period, a very large share of kids are napping a consistent two naps per day. Over the period between 12 and 18 months, this shifts toward one nap. And then sometime in the range of 3 to 5 years, naps are dropped. What I think is perhaps most useful about this graph is it gives a lot of color to the average napping ages that we often hear.

Note: Survey data came from the ParentData audience and users of the Nanit sleep monitor system. Both audiences skew higher-education and higher-income than the average, and mostly have younger children. The final sample is 14,919 children. For more insights on our respondents, read the full article.
...

Happy Father’s Day to the Fathers and Father figures in our ParentData community! 

Tag a Dad who this holiday may be tricky for. We’re sending you love. 💛

Happy Father’s Day to the Fathers and Father figures in our ParentData community!

Tag a Dad who this holiday may be tricky for. We’re sending you love. 💛
...

“Whilst googling things like ‘new dad sad’ and ‘why am I crying new dad,’ I came across an article written by a doctor who had trouble connecting with his second child. I read the symptoms and felt an odd sense of relief.” Today we’re bringing back an essay by Kevin Maguire of @newfatherhood about his experience with paternal postpartum depression. We need to demystify these issues in order to change things for the better. Comment “Link” for a DM to read his full essay.

#parentdata #postpartum #postpartumdepression #paternalmentalhealth #newparents #emilyoster
...

What does the data say about children who look more like one parent? Do they also inherit more character traits and mannerisms from that parent? Let’s talk about it 🔎

#emilyoster #parentdata #parentingcommunity #lookslikedaddy #lookslikemommy

What does the data say about children who look more like one parent? Do they also inherit more character traits and mannerisms from that parent? Let’s talk about it 🔎

#emilyoster #parentdata #parentingcommunity #lookslikedaddy #lookslikemommy
...

SLEEP DATA 💤 We asked you all about your kids’ sleep—and got nearly 15,000 survey responses to better understand kids’ sleep patterns. Comment “Link” for an article that breaks down our findings!

This graph shows sleeping location by age. You’ll notice that for the first three months, most kids are in their own sleeping location in a parent’s room. Then, over the first year, this switches toward their own room. As kids age, sharing a room with a sibling becomes more common. 

Head to the newsletter for more and stay tuned for part two next week on naps! 🌙

#parentdata #emilyoster #childsleep #babysleep #parentingcommunity

SLEEP DATA 💤 We asked you all about your kids’ sleep—and got nearly 15,000 survey responses to better understand kids’ sleep patterns. Comment “Link” for an article that breaks down our findings!

This graph shows sleeping location by age. You’ll notice that for the first three months, most kids are in their own sleeping location in a parent’s room. Then, over the first year, this switches toward their own room. As kids age, sharing a room with a sibling becomes more common.

Head to the newsletter for more and stay tuned for part two next week on naps! 🌙

#parentdata #emilyoster #childsleep #babysleep #parentingcommunity
...

Weekends are good for extra cups of ☕️ and listening to podcasts. I asked our team how they pod—most people said on walks or during chores. What about you?

Comment “Link” to subscribe to ParentData with Emily Oster, joined by some excellent guests.

#parentdata #parentdatapodcast #parentingpodcast #parentingtips #emilyoster
...